The Flow of Money: An Overview
The master flow dataset of the Atlas follows money from its source, through the bloc it strengthens, to its function and recipient. This chapter brings together the headline visuals built on it: the master and domain flow diagrams, the treemap of recipients, the time series by module and the networks of funders and recipients.
The 15 figures in this chapter are reproduced from the Atlas report and its synthesis, with the passage of the study that explains each. They keep the study’s own labels and colours: RW denotes the Hindutva-aligned bloc and LW the coalition that contests it (see A Note on Terms).
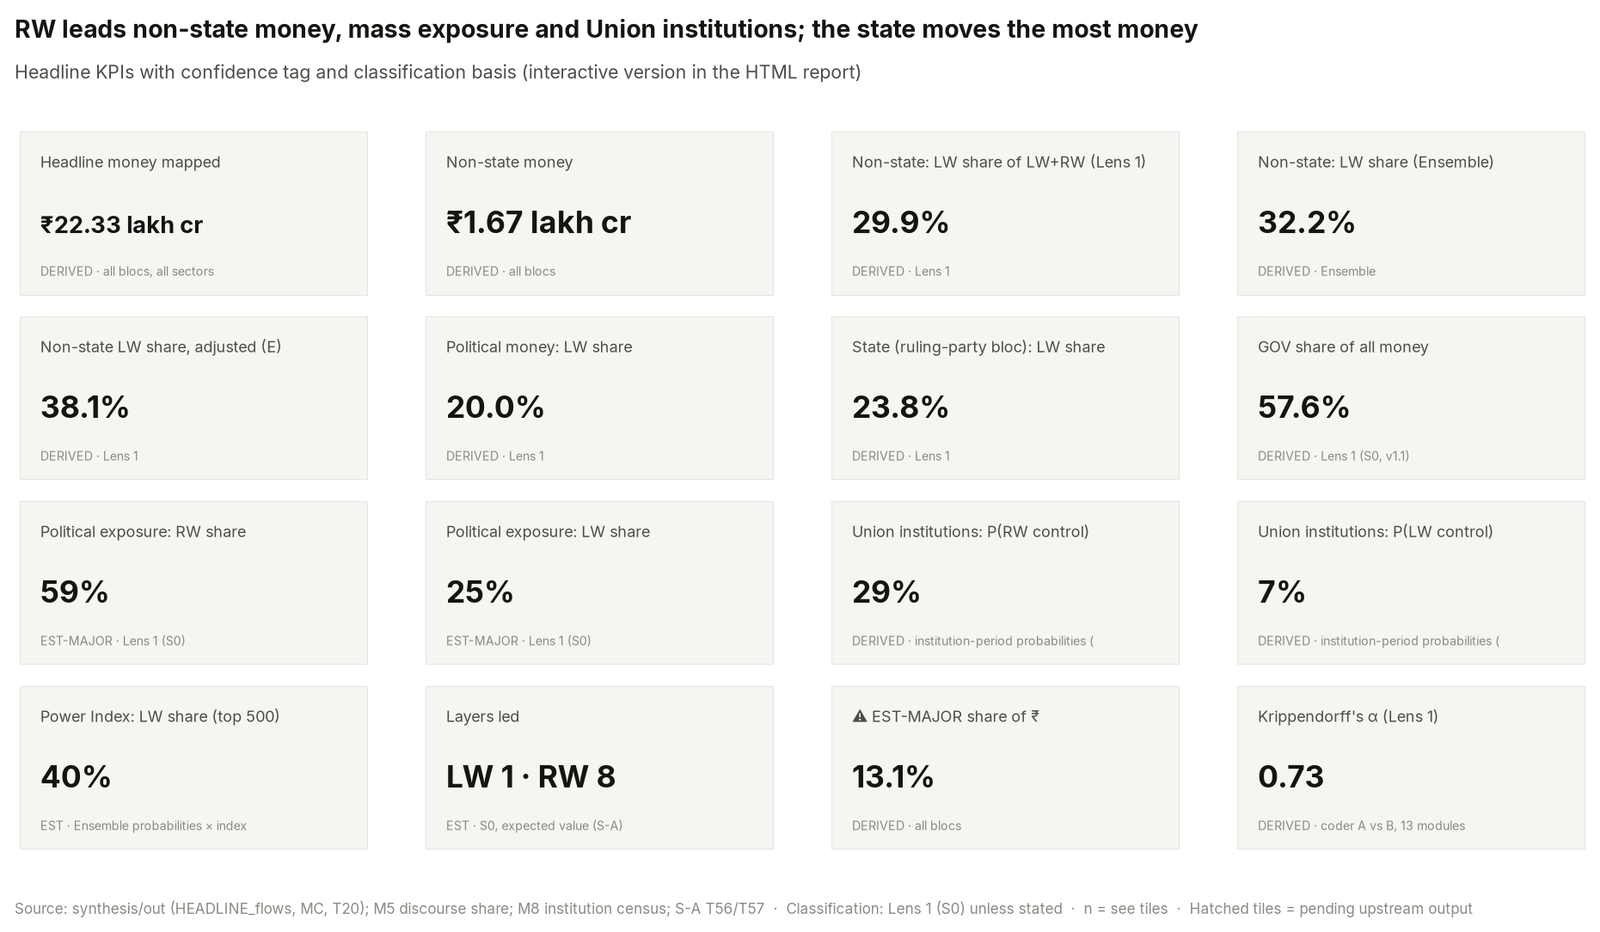
Source: synthesis/out (HEADLINE_flows, MC, T20); M5 discourse share; M8 institution census; S-A T56/T57.
Headline KPIs with confidence tag and classification basis (interactive version in the HTML report). Classification basis: Lens 1 (S0) unless stated.
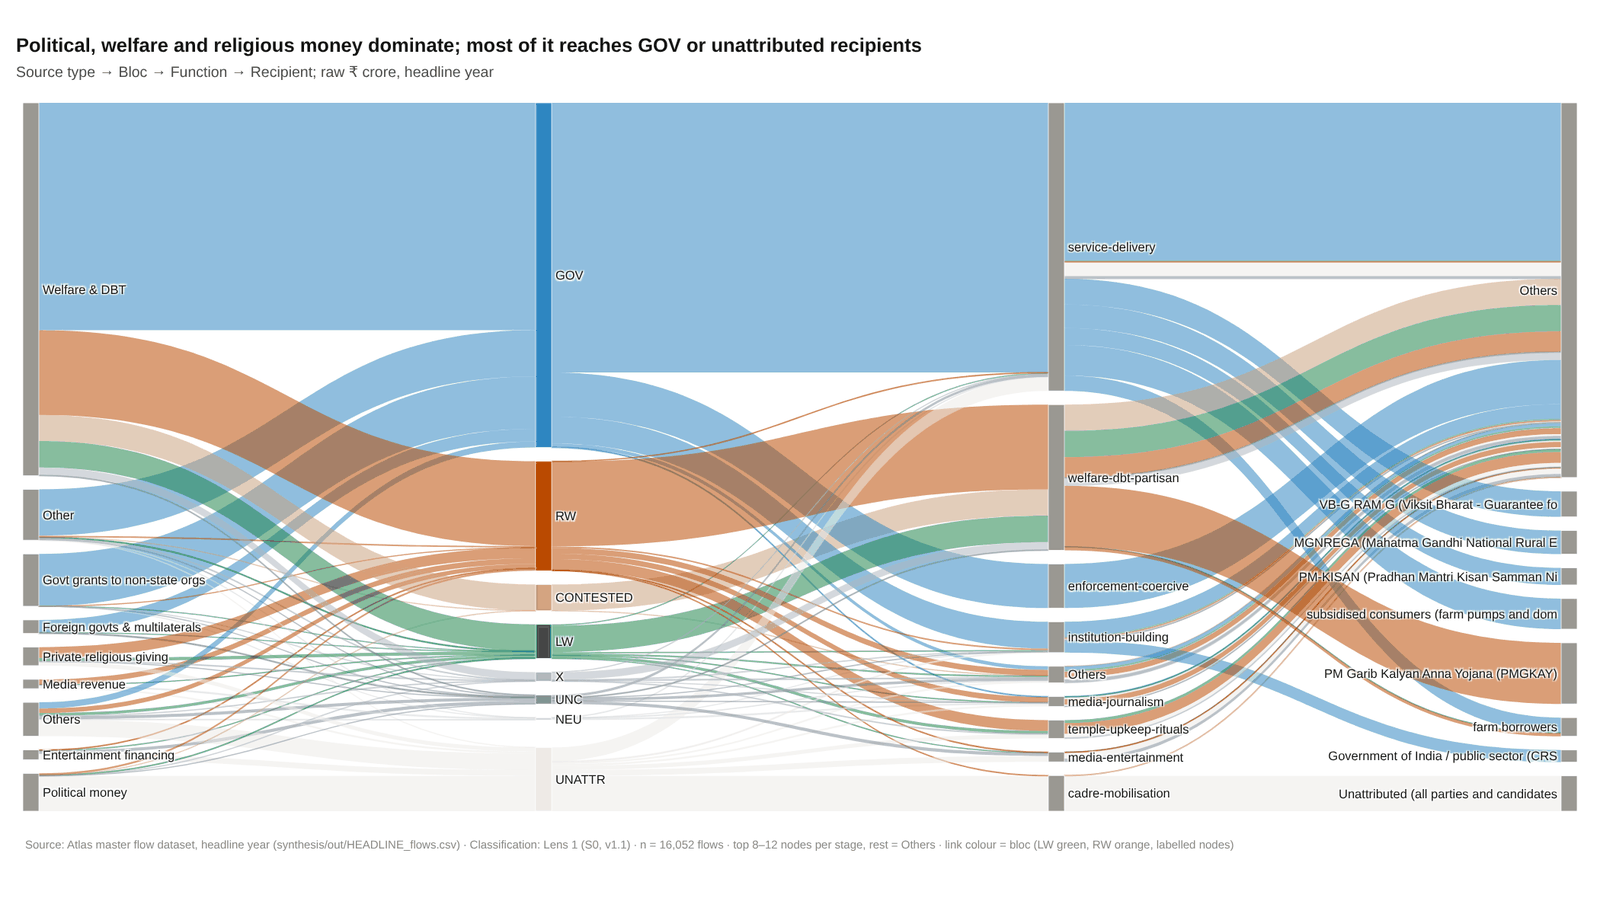
Source: Atlas master flow dataset, headline year (synthesis/out/HEADLINE_flows.csv).
Source type → Bloc → Function → Recipient; raw ₹ crore. n = 5,216 flows. Classification basis: Lens 1 (S0, v1.1).
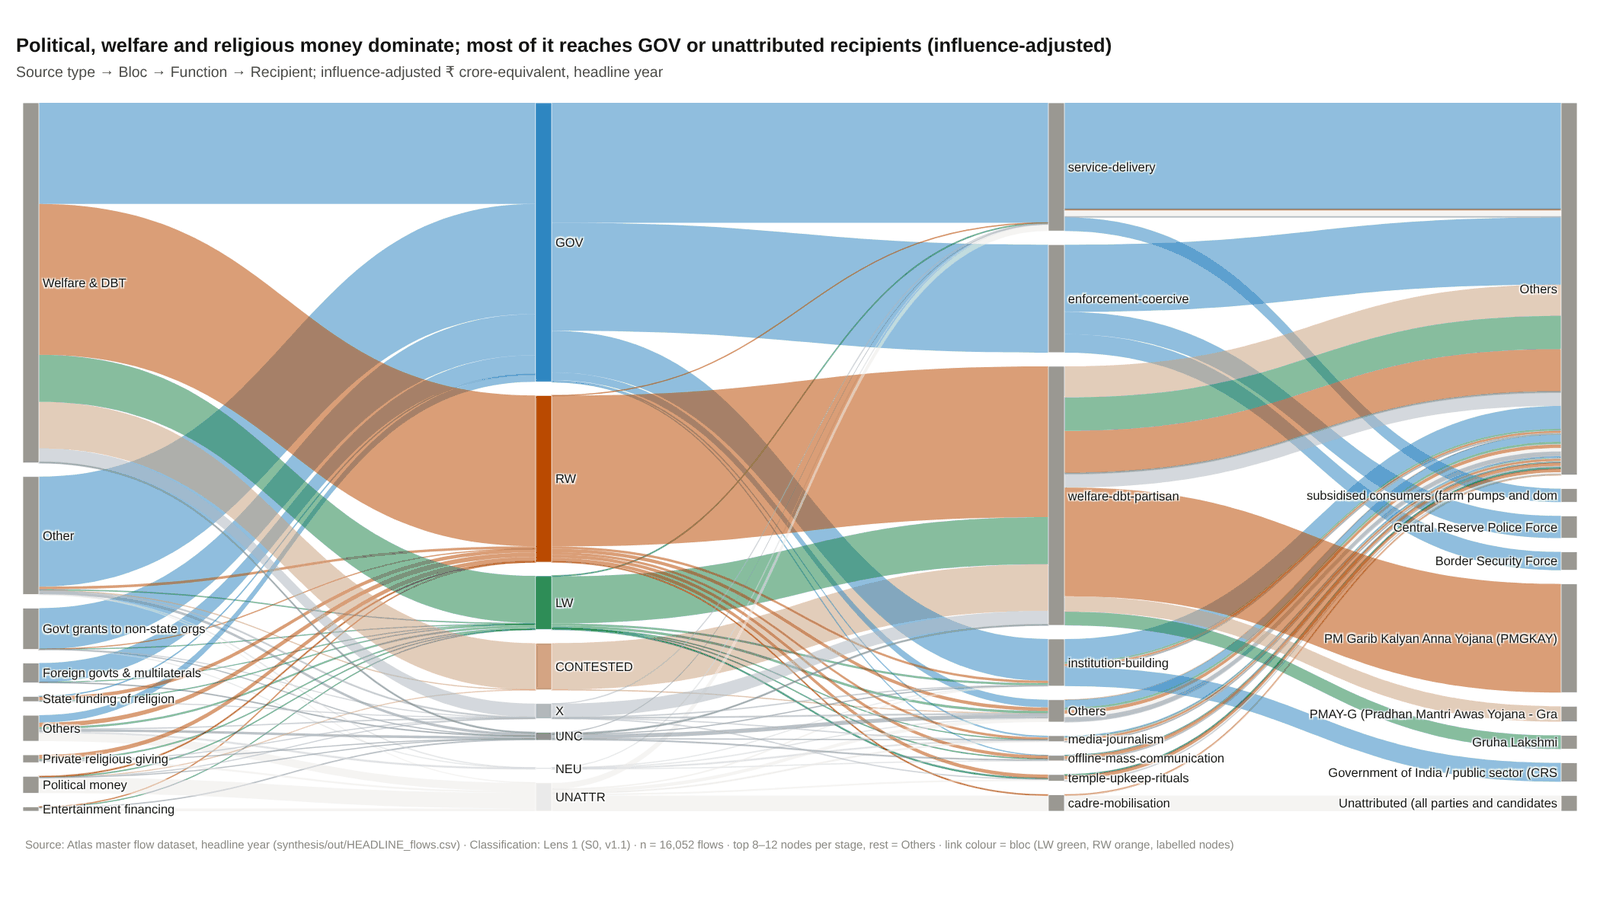
Source: Atlas master flow dataset, headline year (synthesis/out/HEADLINE_flows.csv).
Source type → Bloc → Function → Recipient; influence-adjusted ₹ crore-equivalent. n = 5,216 flows. Classification basis: Lens 1 (S0, v1.1).
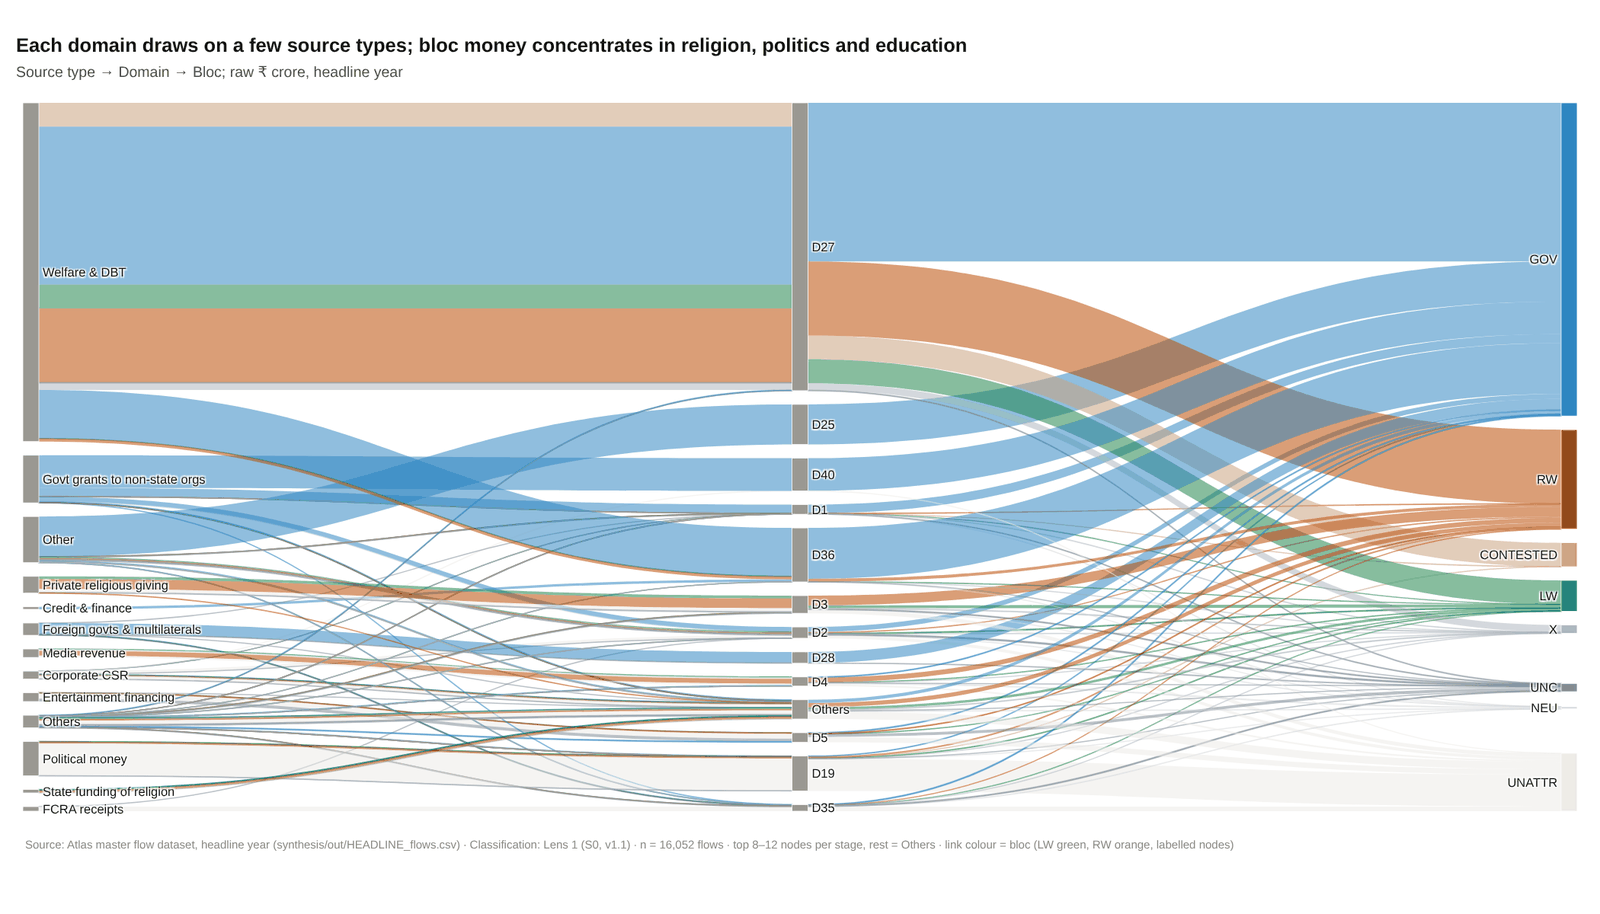
Source: Atlas master flow dataset, headline year (synthesis/out/HEADLINE_flows.csv).
Source type → Domain → Bloc; raw ₹ crore. n = 5,216 flows. Classification basis: Lens 1 (S0, v1.1).
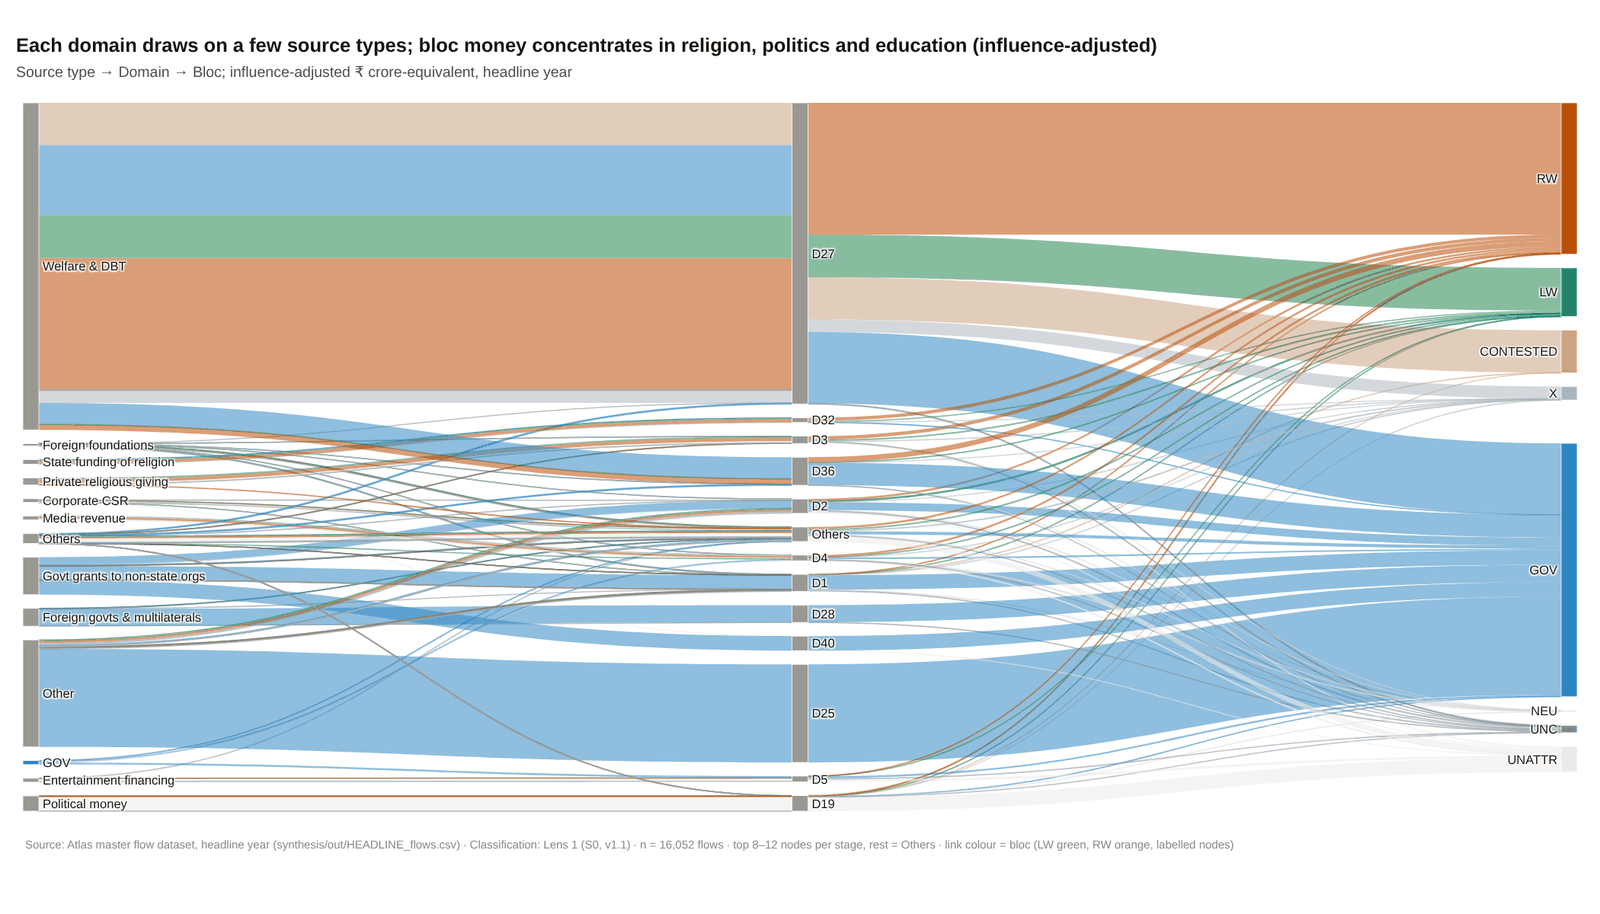
Source: Atlas master flow dataset, headline year (synthesis/out/HEADLINE_flows.csv).
Source type → Domain → Bloc; influence-adjusted ₹ crore-equivalent. n = 5,216 flows. Classification basis: Lens 1 (S0, v1.1).
Source: Atlas master flow dataset, headline year (synthesis/out/HEADLINE_flows.csv).
Bloc → domain → function → recipient; raw ₹ crore. n = 5,216 flows. Classification basis: Lens 1 (S0, v1.1).
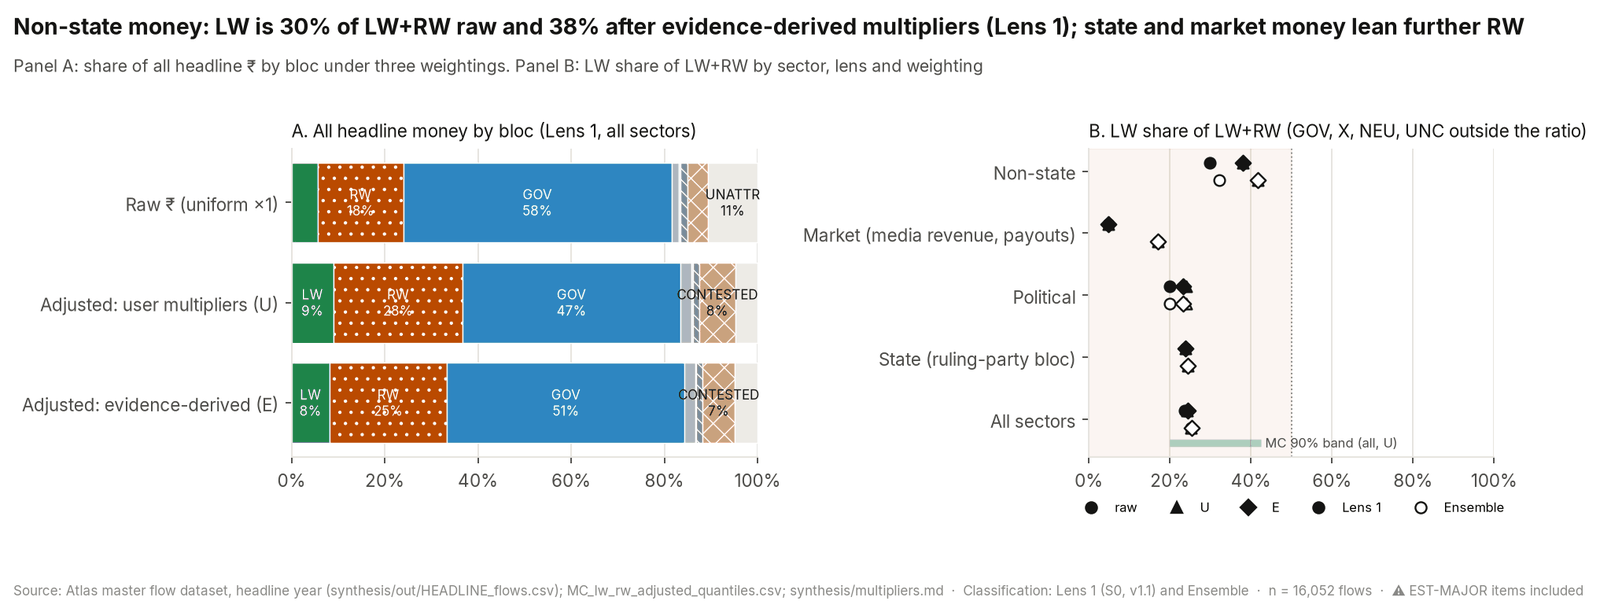
Source: Atlas master flow dataset, headline year (synthesis/out/HEADLINE_flows.csv); MC_lw_rw_adjusted_quantiles.csv; synthesis/multipliers.md.
Panel A: share of all headline ₹ by bloc under three weightings. Panel B: LW share of LW+RW by sector, lens and weighting. n = 5,216 flows. Classification basis: Lens 1 (S0, v1.1) and Ensemble.
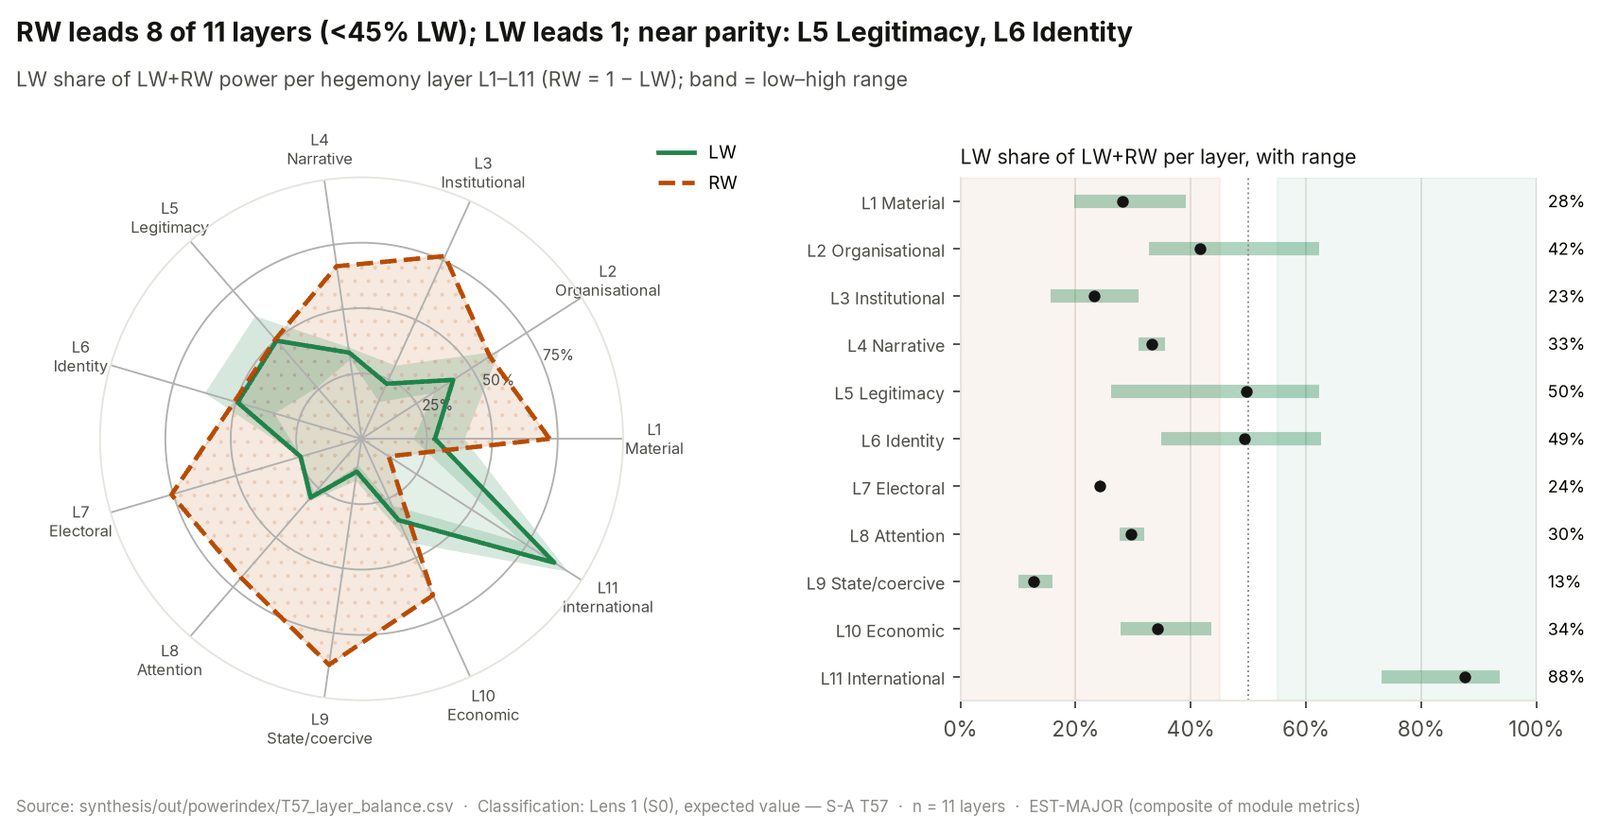
Source: synthesis/out/powerindex/T57_layer_balance.csv.
LW share of LW+RW power per hegemony layer L1–L11 (RW = 1 − LW); band = low–high range. n = 11 layers. Classification basis: Lens 1 (S0), expected value — S-A T57.
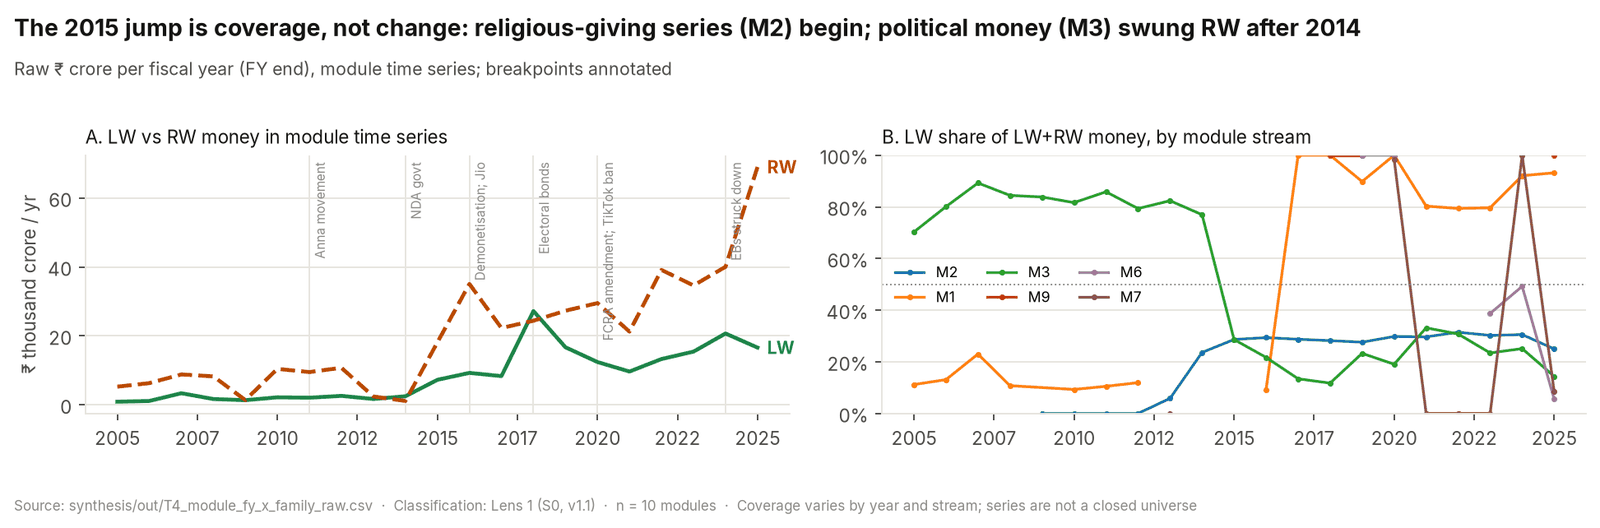
Source: synthesis/out/T4_module_fy_x_family_raw.csv.
Raw ₹ crore per fiscal year (FY end), module time series; breakpoints annotated. n = 9 modules. Classification basis: Lens 1 (S0, v1.1).
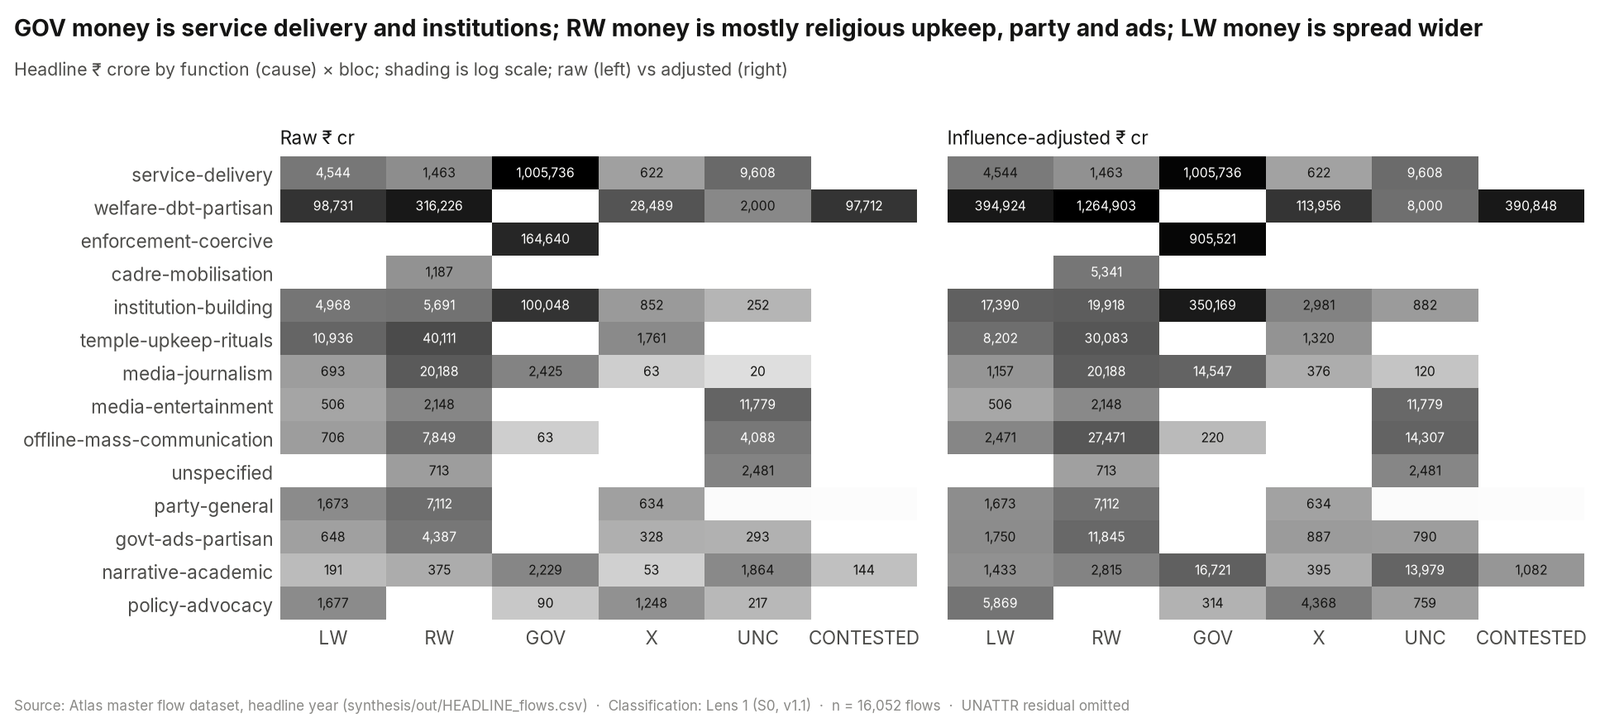
Source: Atlas master flow dataset, headline year (synthesis/out/HEADLINE_flows.csv).
Headline ₹ crore by function (cause) × bloc; shading is log scale; raw (left) vs adjusted (right). n = 5,216 flows. Classification basis: Lens 1 (S0, v1.1).
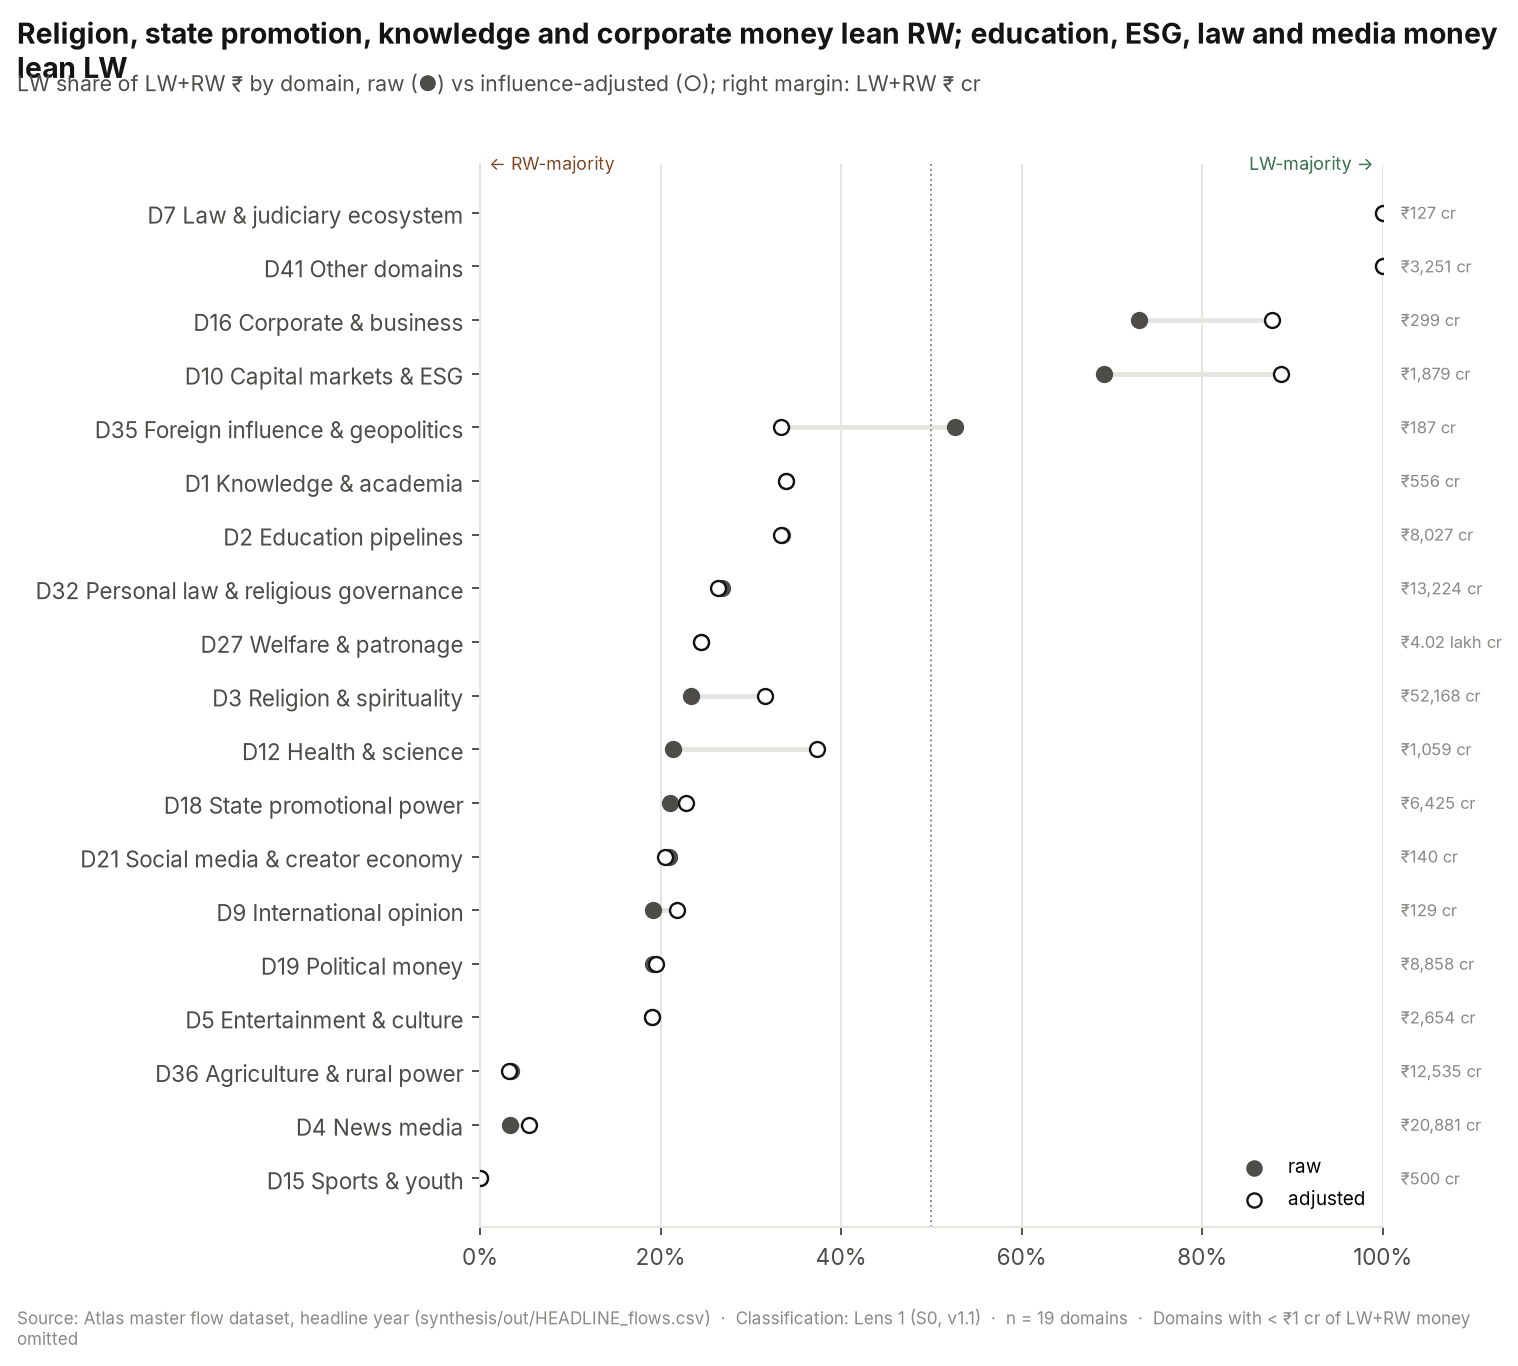
Source: Atlas master flow dataset, headline year (synthesis/out/HEADLINE_flows.csv).
LW share of LW+RW ₹ by domain, raw (●) vs influence-adjusted (○); right margin: LW+RW ₹ cr. n = 18 domains. Classification basis: Lens 1 (S0, v1.1).
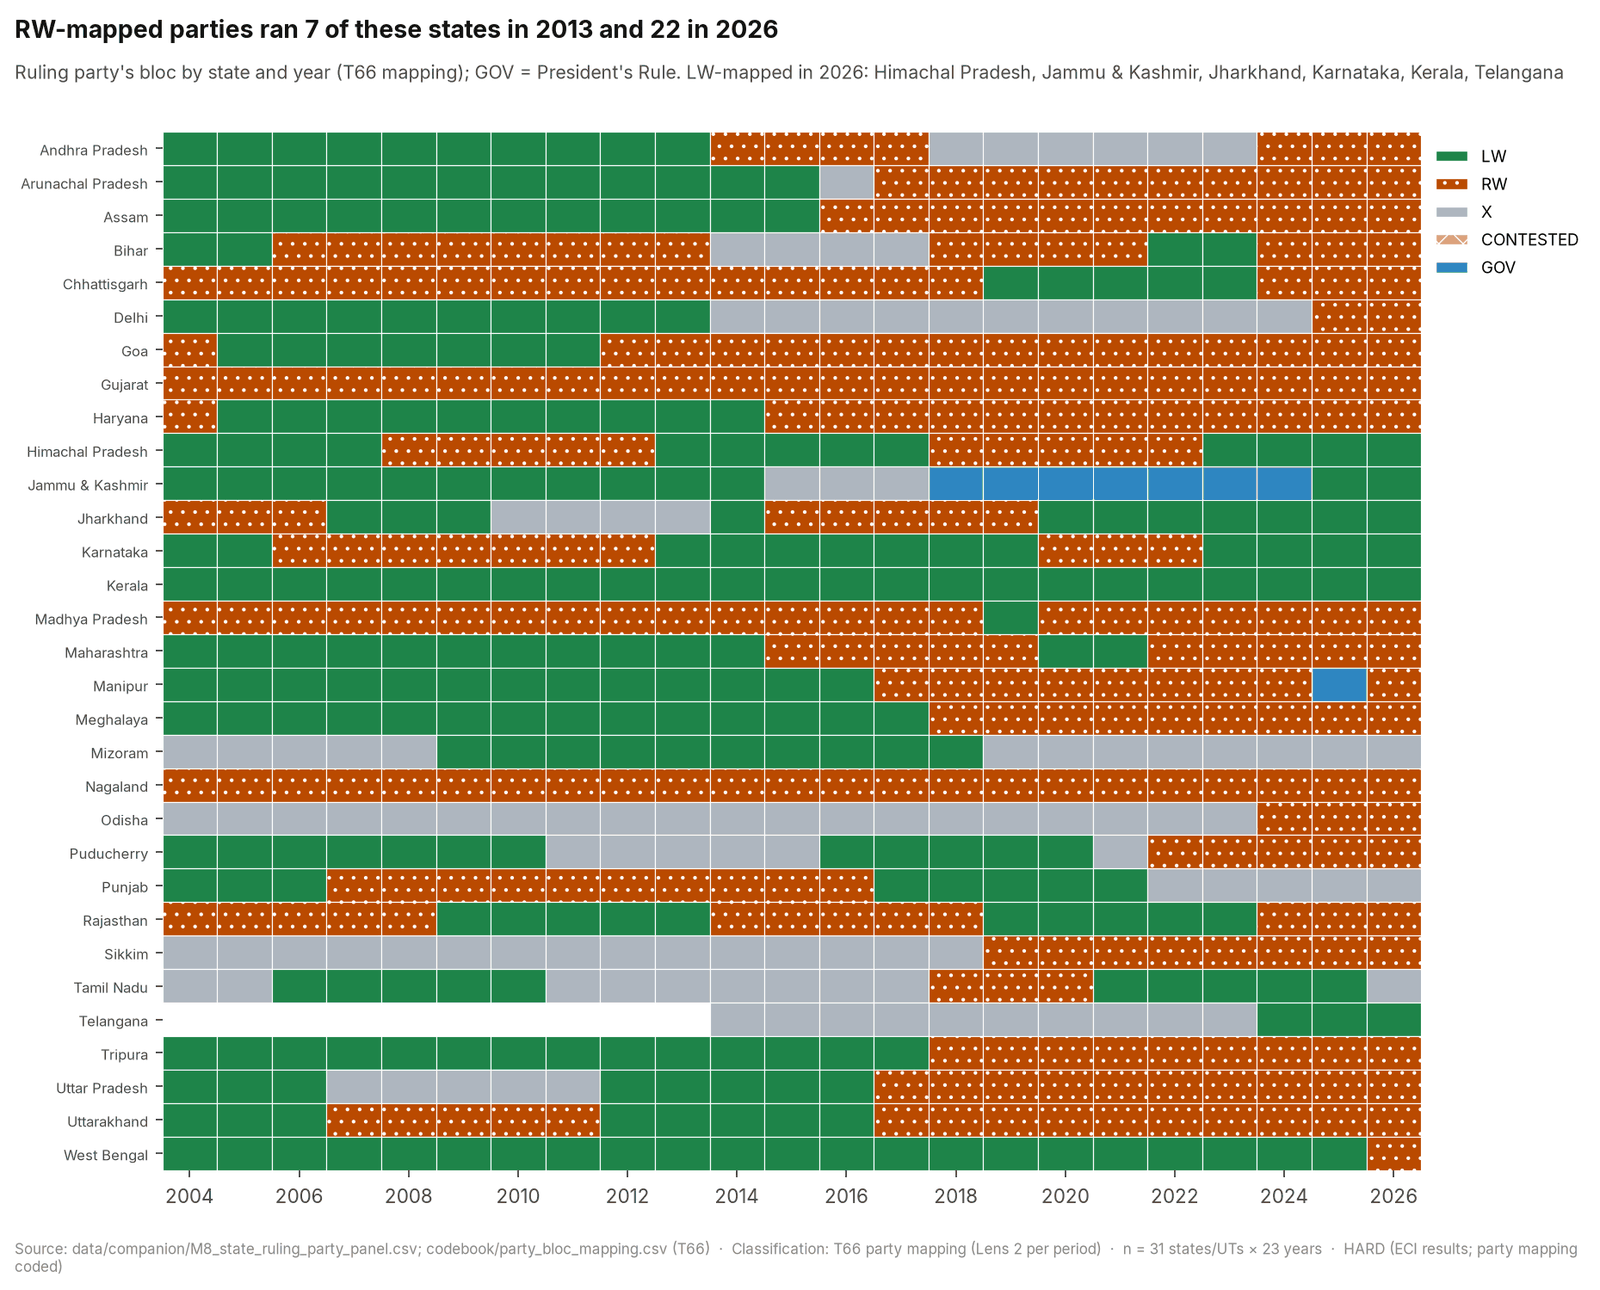
Source: data/companion/M8_state_ruling_party_panel.csv; codebook/party_bloc_mapping.csv (T66).
Ruling party's bloc by state and year (T66 mapping); GOV = President's Rule. LW-mapped in 2026: Himachal Pradesh, Jammu & Kashmir, Jharkhand, Karnataka, Kerala, Telangana. n = 31 states/UTs × 23 years. Classification basis: T66 party mapping (Lens 2 per period).
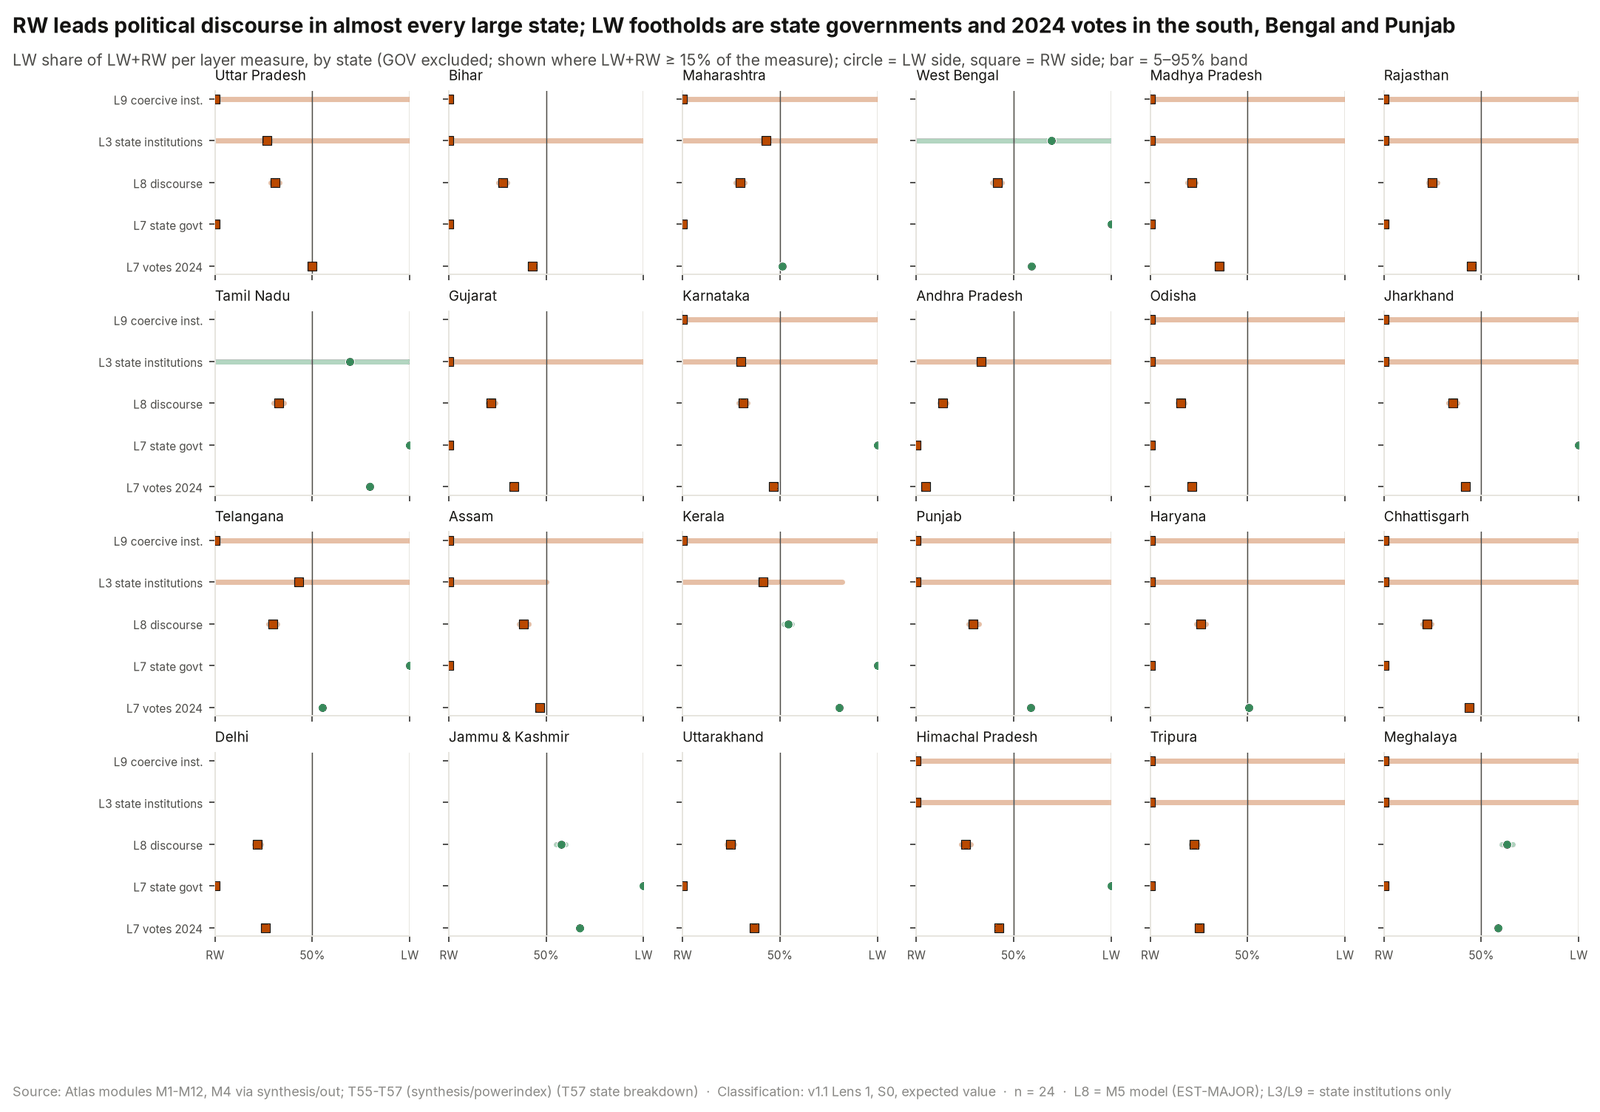
Source: Atlas synthesis.
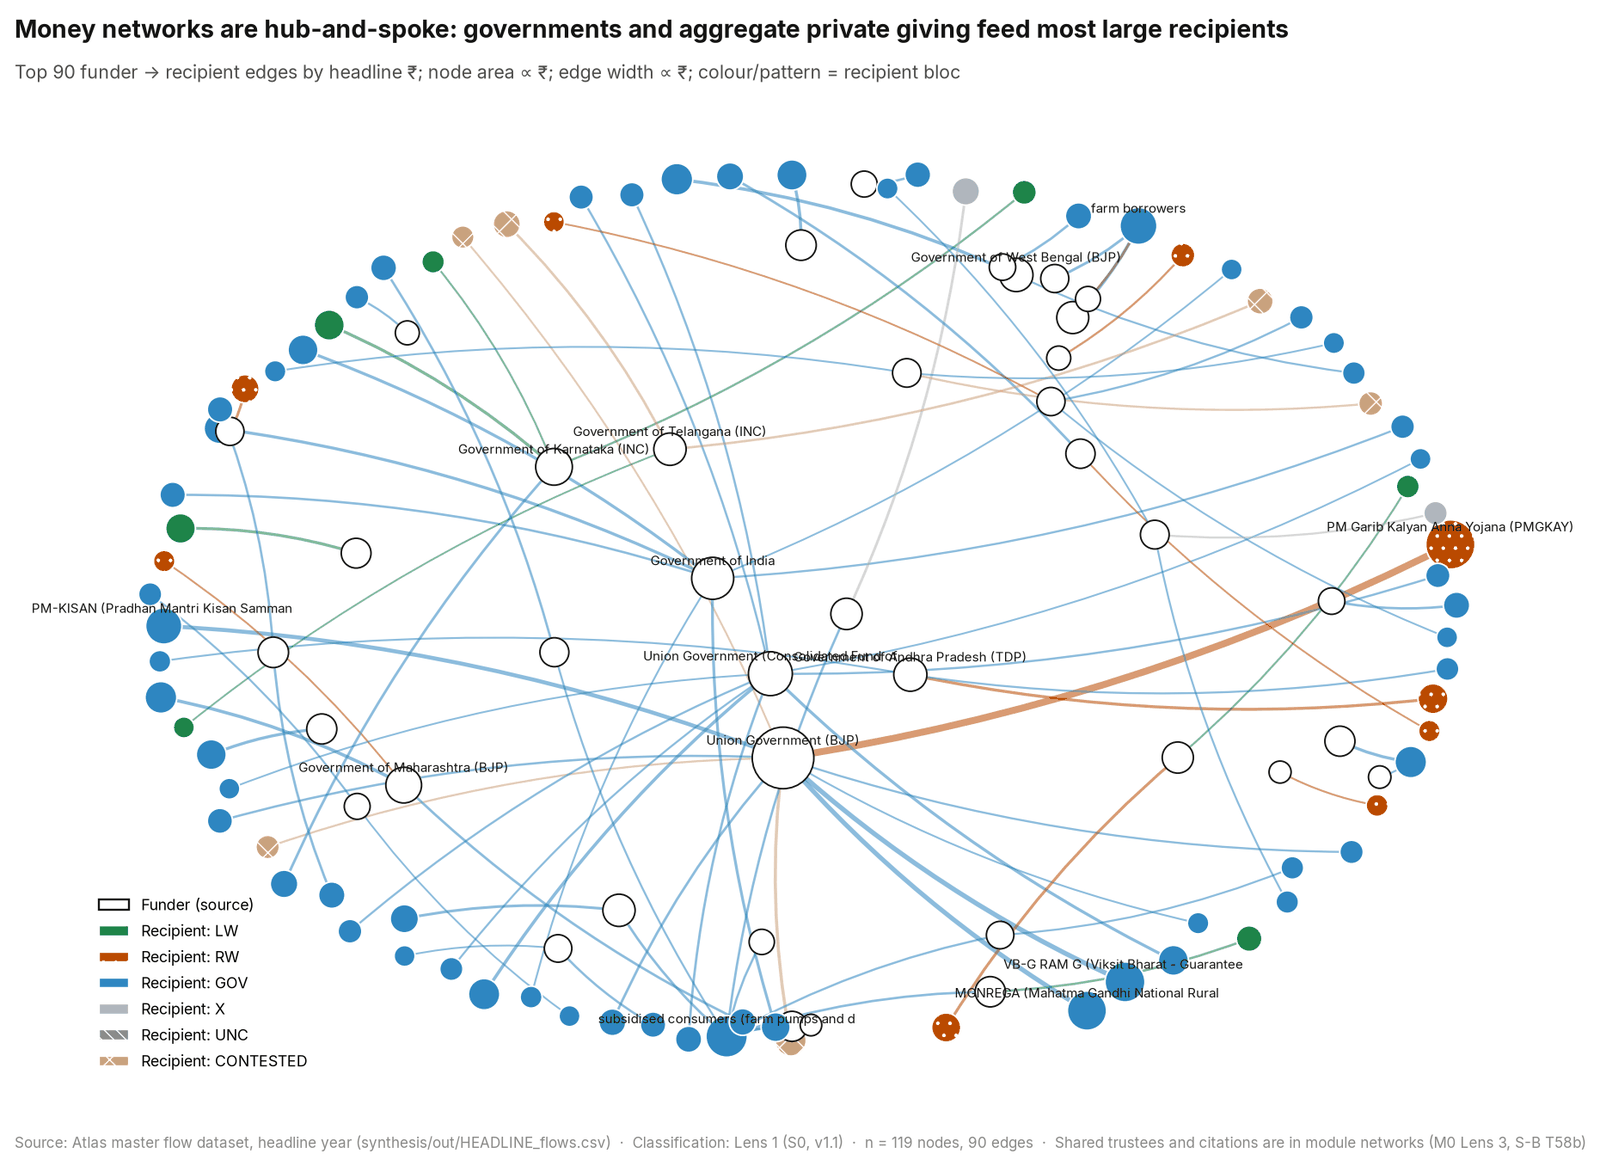
Source: Atlas master flow dataset, headline year (synthesis/out/HEADLINE_flows.csv).
Top 90 funder → recipient edges by headline ₹; node area ∝ ₹; edge width ∝ ₹; colour/pattern = recipient bloc. n = 126 nodes, 90 edges. Classification basis: Lens 1 (S0, v1.1).
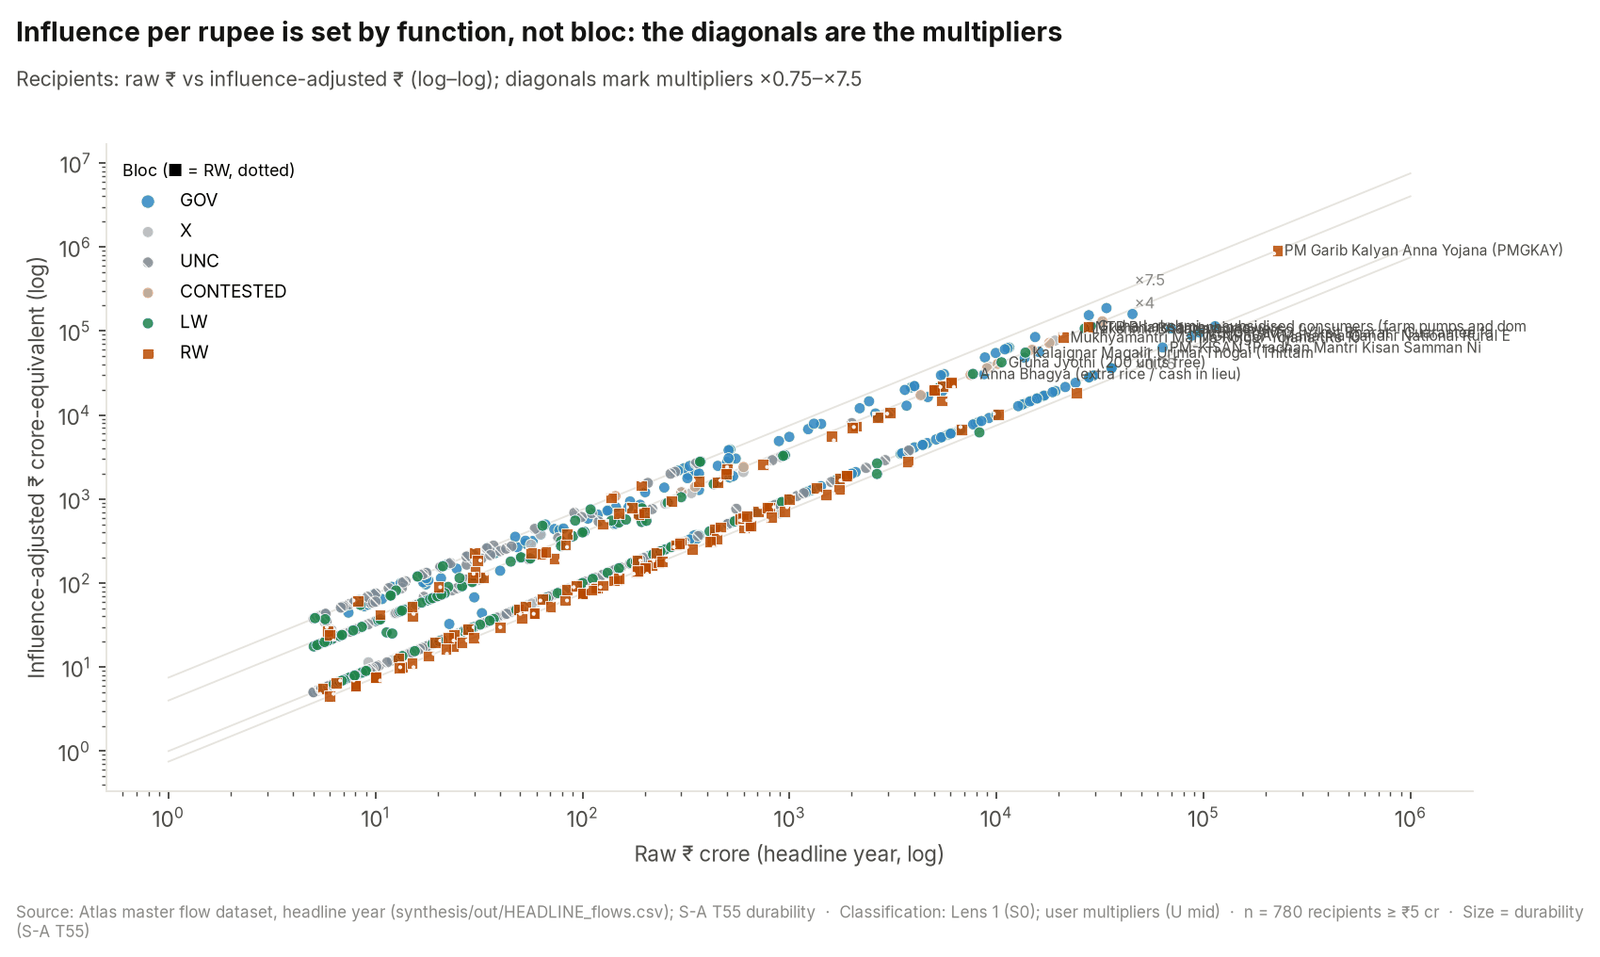
Source: Atlas master flow dataset, headline year (synthesis/out/HEADLINE_flows.csv); S-A T55 durability.
Recipients: raw ₹ vs influence-adjusted ₹ (log–log); diagonals mark multipliers ×0.75–×7.5. n = 828 recipients ≥ ₹5 cr. Classification basis: Lens 1 (S0); user multipliers (U mid).