Calibration and Classification
How units were classified and how far the classification can be trusted: anchor accuracy, agreement between lenses, the ideological space of coded units and the sensitivity of results to classification rules.
The 14 figures in this chapter are reproduced from the report of Atlas research module M0, with the passage of the study that explains each. They keep the study’s own labels and colours: RW denotes the Hindutva-aligned bloc and LW the coalition that contests it (see A Note on Terms).
59.12. Double coding and accuracy
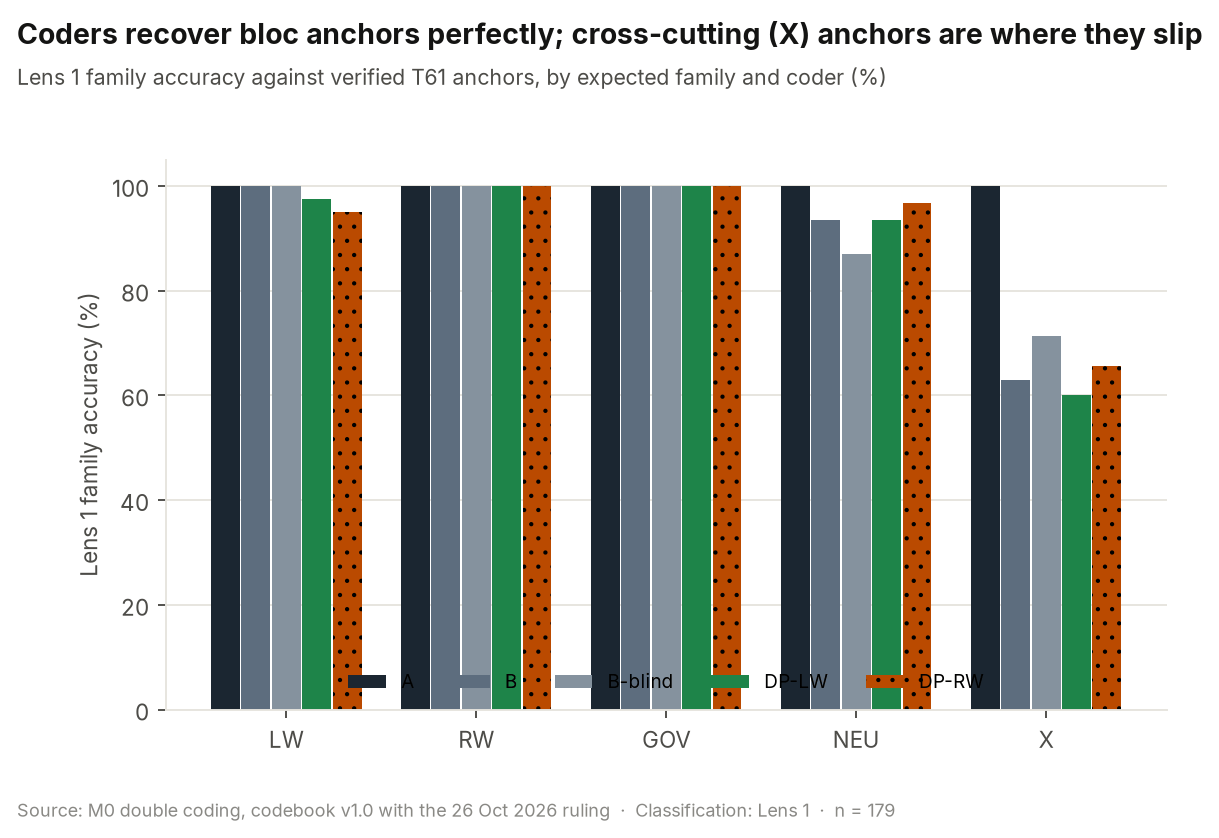
Source: Atlas research module M0, “2. Double coding and accuracy”.
under different ids.
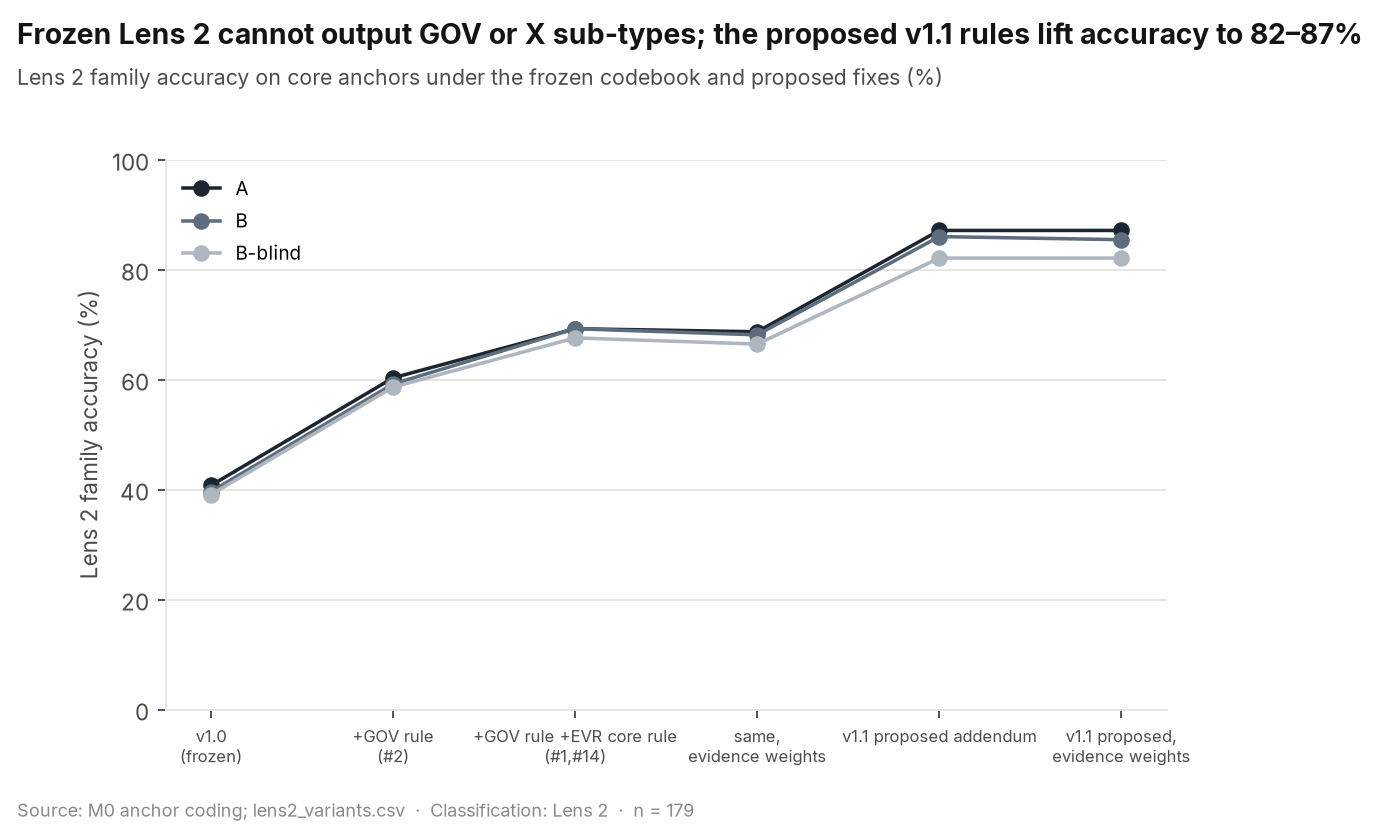
Source: Atlas research module M0, “2. Double coding and accuracy”.
Ensemble family accuracy on the anchors is therefore 34%–37%, against 100% for LW. The proposed v1.1 rules lift Lens 2 family accuracy to 82%–87% on core anchors, and to 68%–76% on the hold-out anchors. They are not adopted; the lead decides.
59.24. Dimension weights (8C)
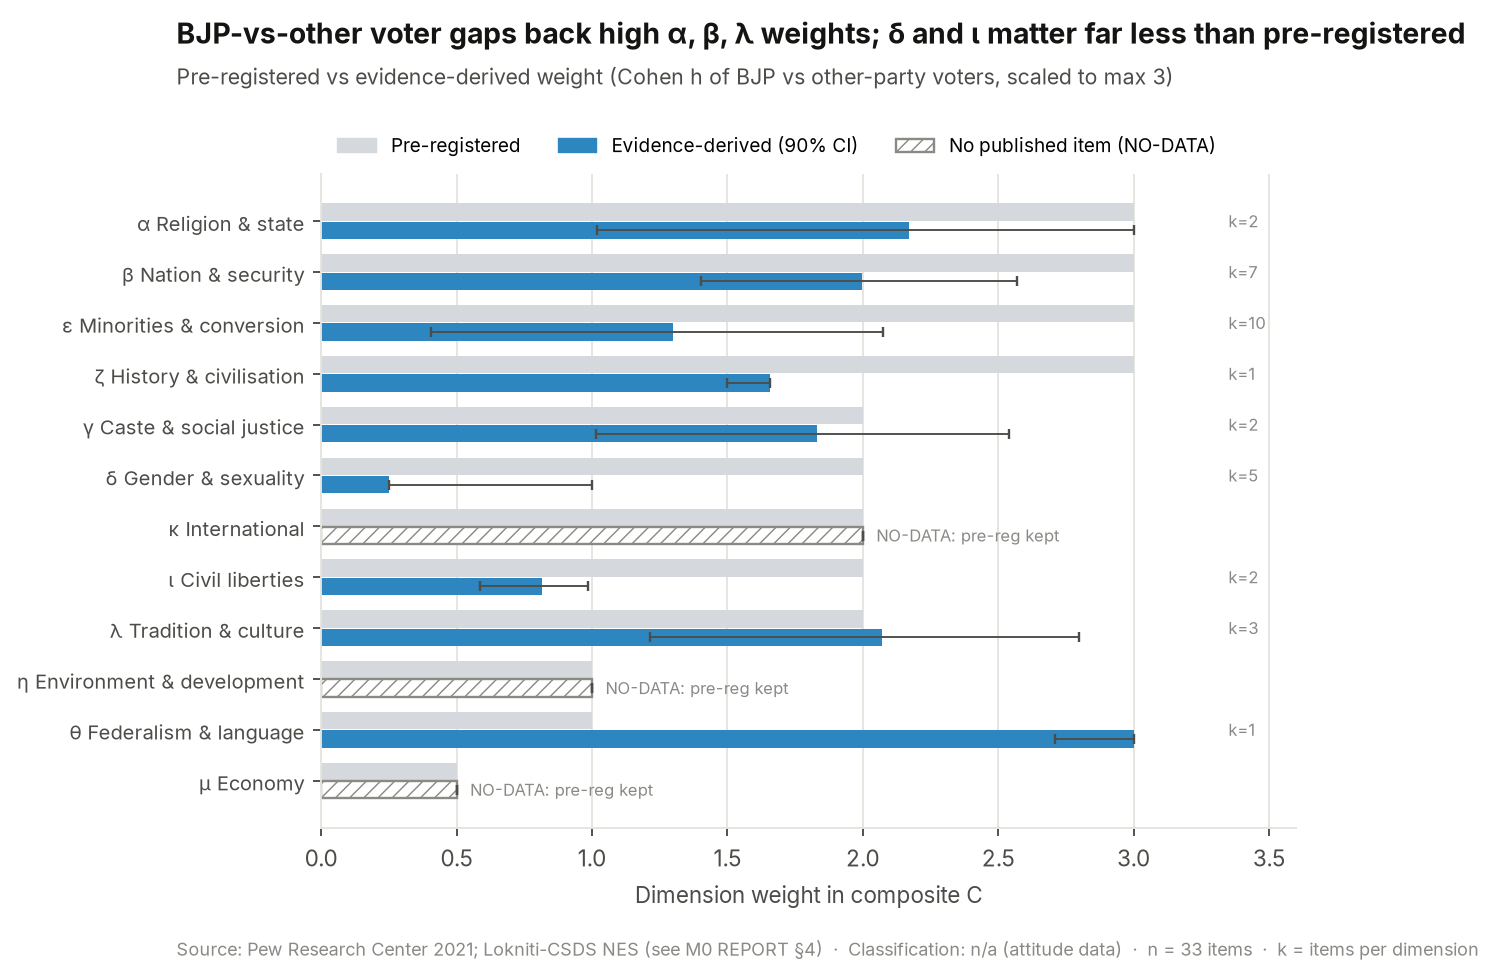
Source: Atlas research module M0, “4. Dimension weights (8C)”.
Drift (re-code a random 10%). A fresh coder-B session re-coded 18 earlier packs under new ids: family α 0.847, sub-type α 0.870, family agreement 88.9% (n=18). The two changes are NPCI (NEU → GOV, the GOV/NEU line) and AAP (UNC → X-MIX).
59.35. Lead ruling of 26 Oct 2026: re-test
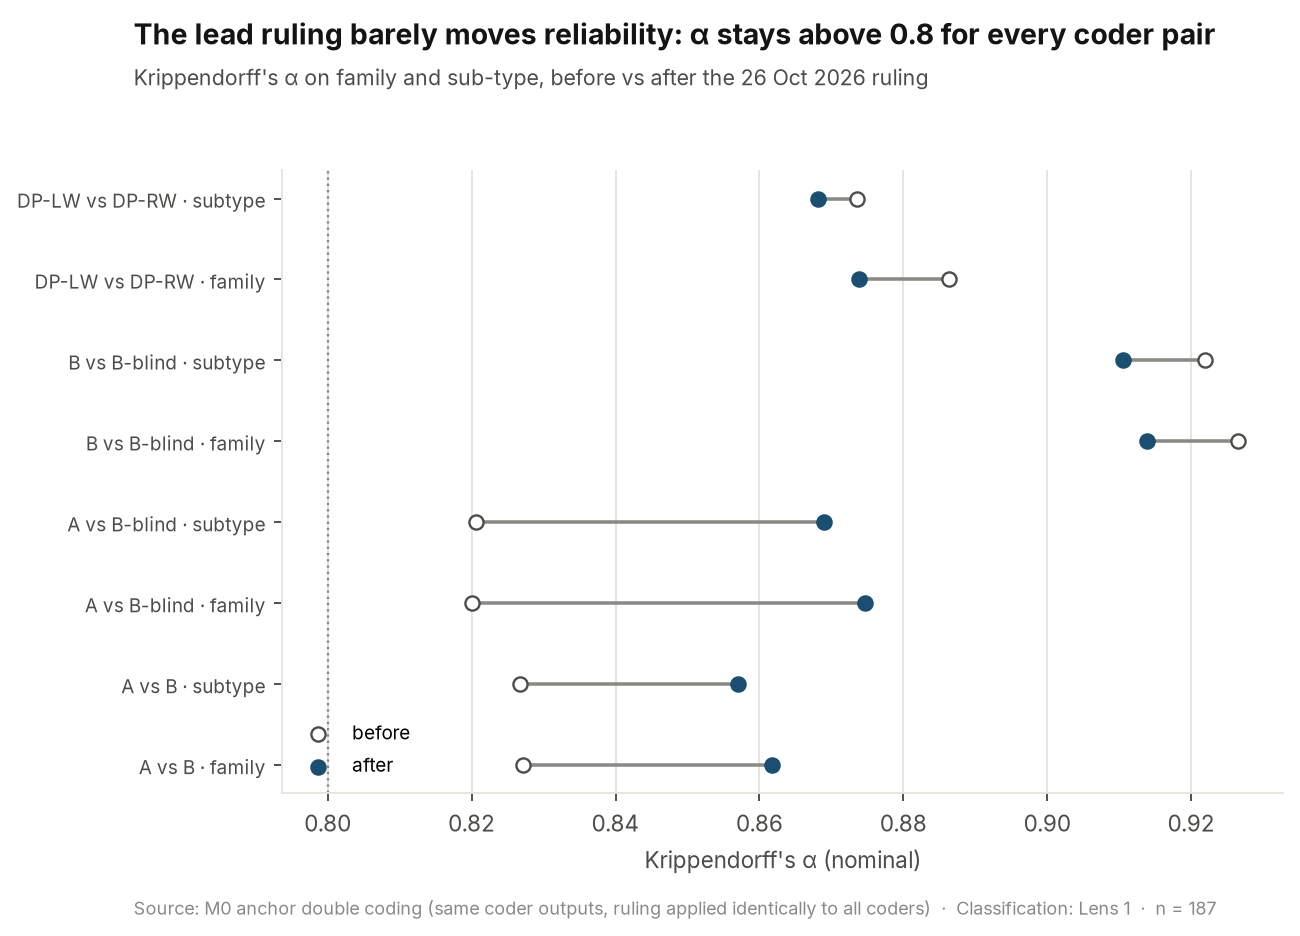
Source: Atlas research module M0, “5. Lead ruling of 26 Oct 2026: re-test”.
(raw/coding/ruling_retest.json).
59.46. Tooling
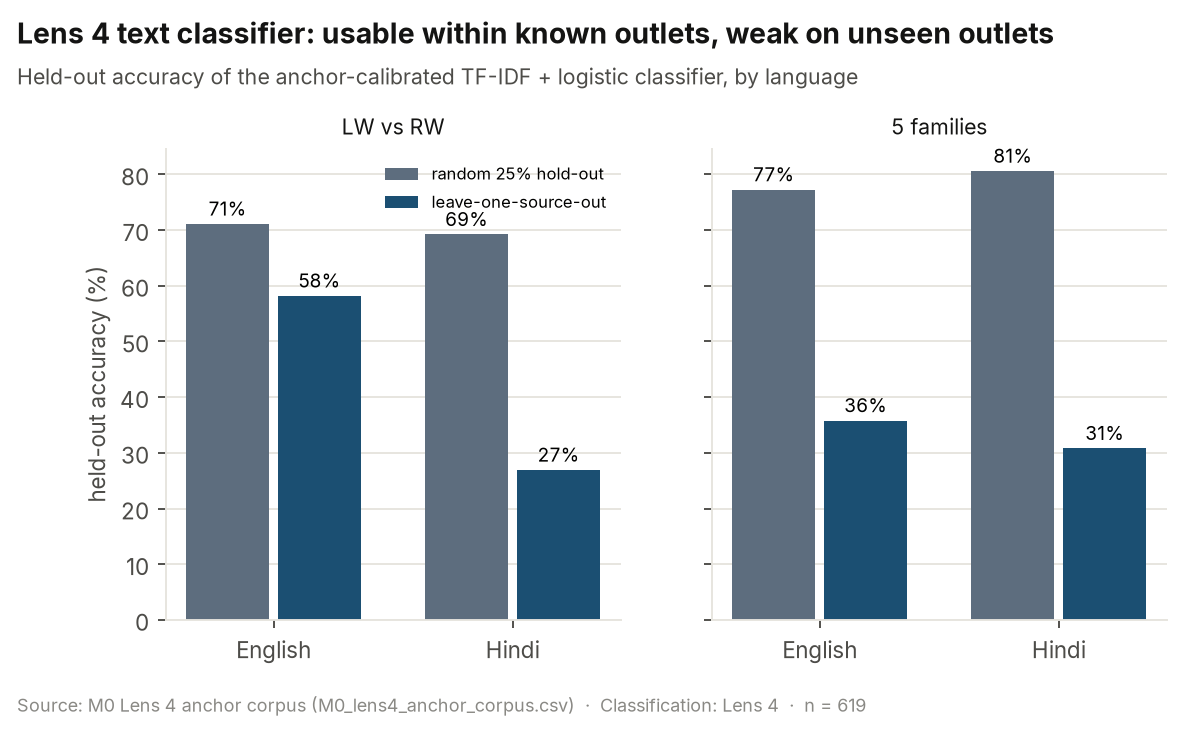
Source: Atlas research module M0, “6. Tooling”.
Total 619 items. Target ≥50 per family per language.
59.5Confidence map: HARD vs EST vs per total
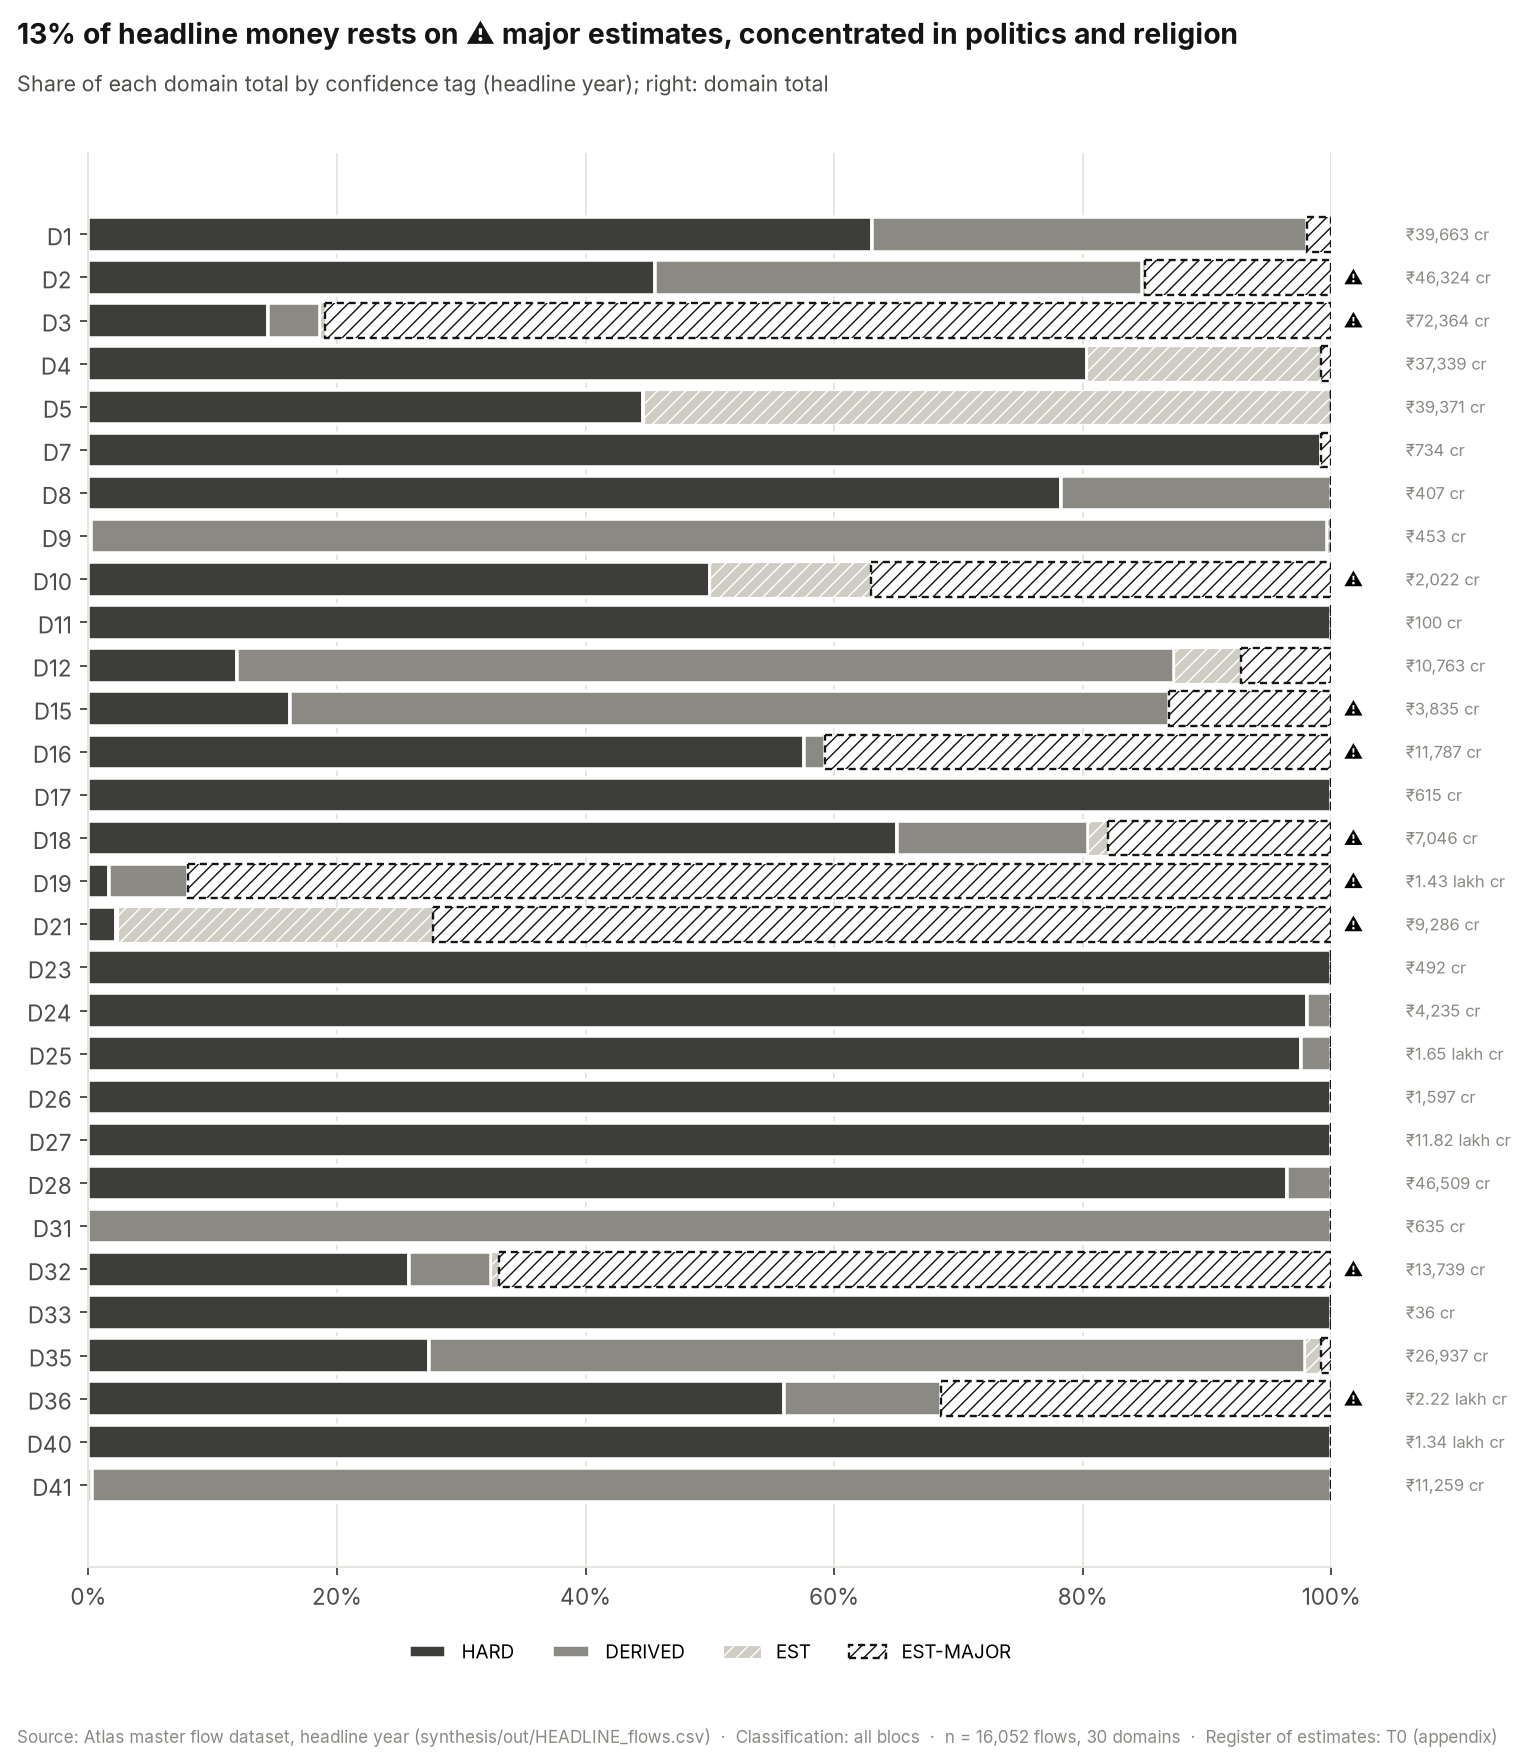
Source: Atlas master flow dataset, headline year (synthesis/out/HEADLINE_flows.csv).
Share of each domain total by confidence tag (headline year); right: domain total. n = 5,216 flows, 26 domains. Classification basis: all blocs.
59.6Classification audit: Lens 1 vs Ensemble agreement matrix
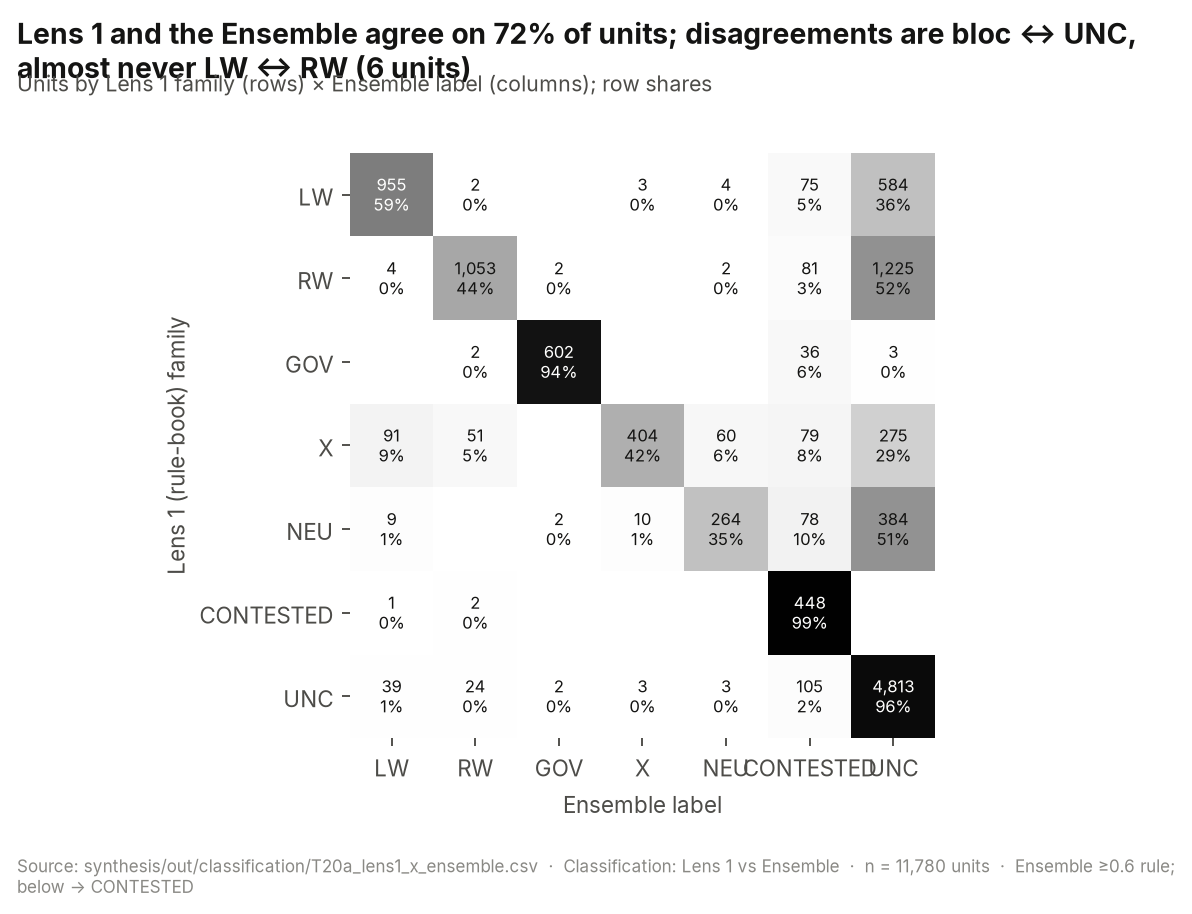
Source: synthesis/out/classification/T20a_lens1_x_ensemble.csv.
Units by Lens 1 family (rows) × Ensemble label (columns); row shares. n = 11,780 units. Classification basis: Lens 1 vs Ensemble.
59.7Ideological space map (PCA of α–μ)
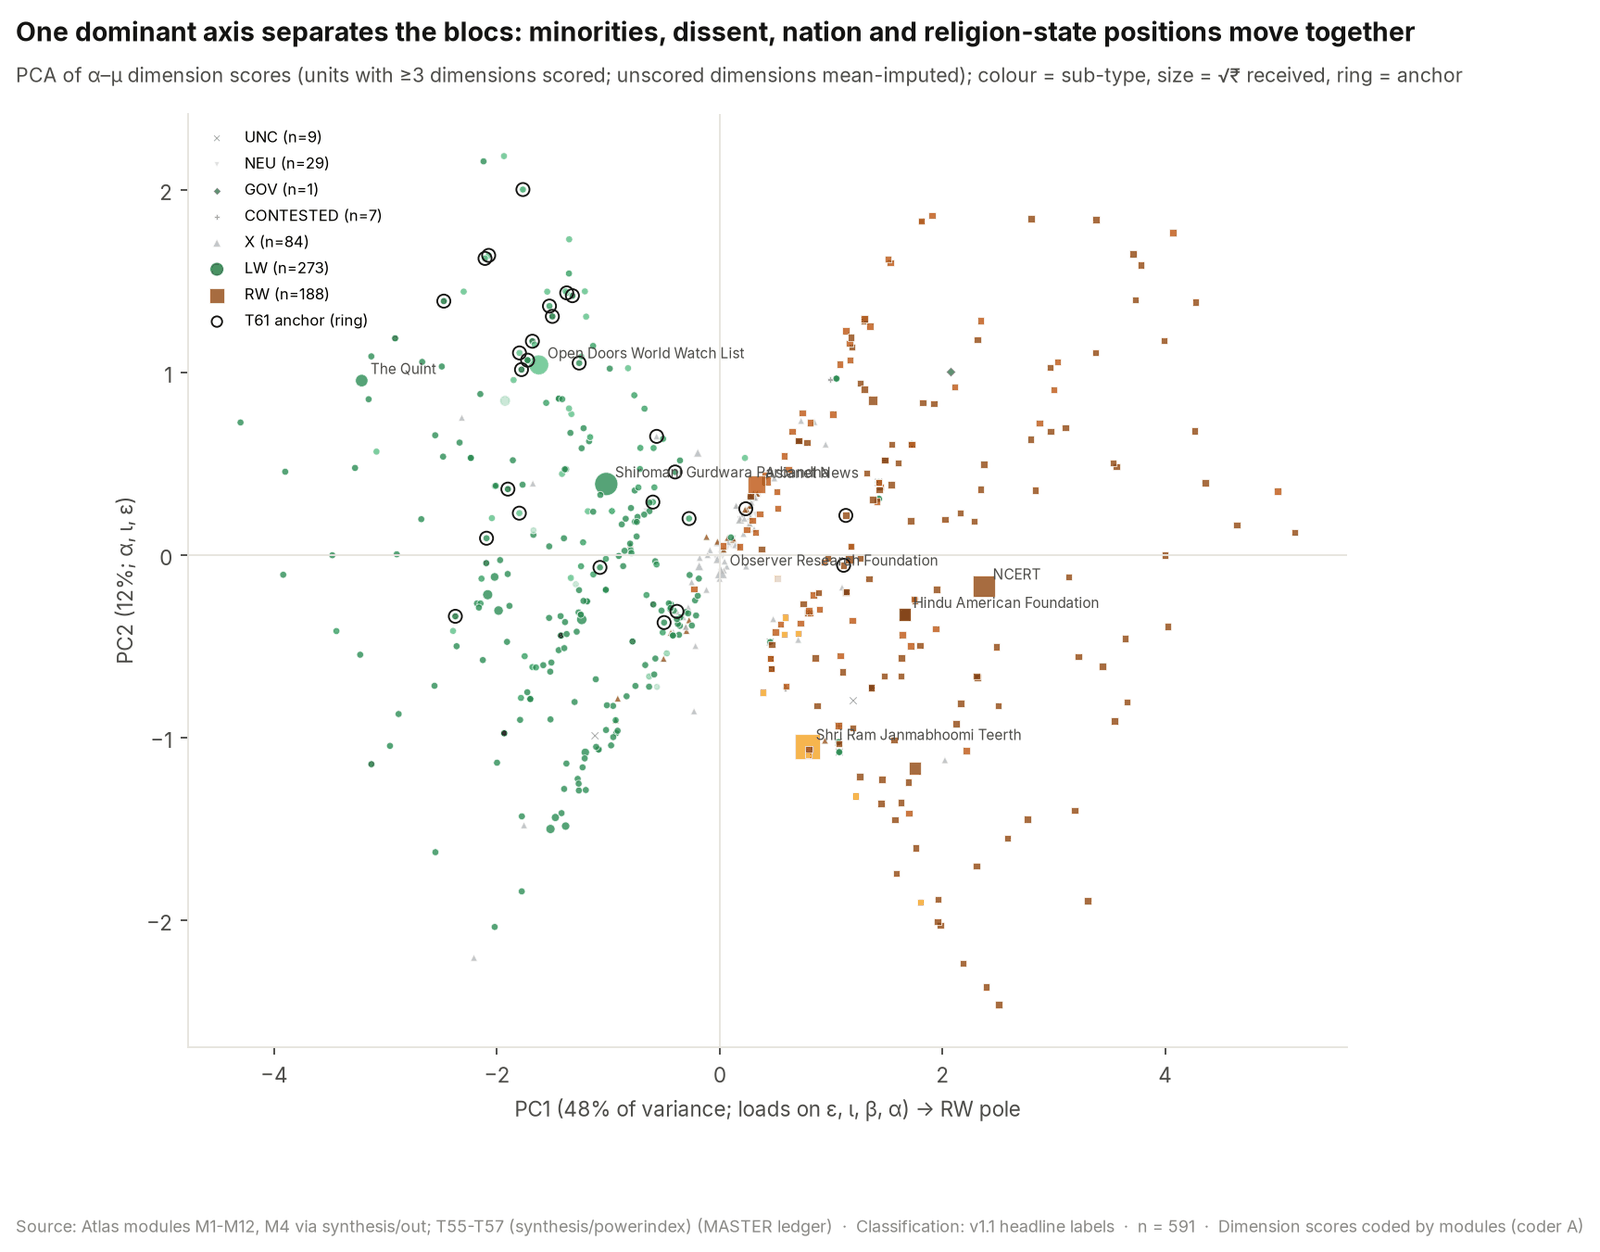
Source: Atlas synthesis.
59.8Dimension profiles (parallel coordinates)
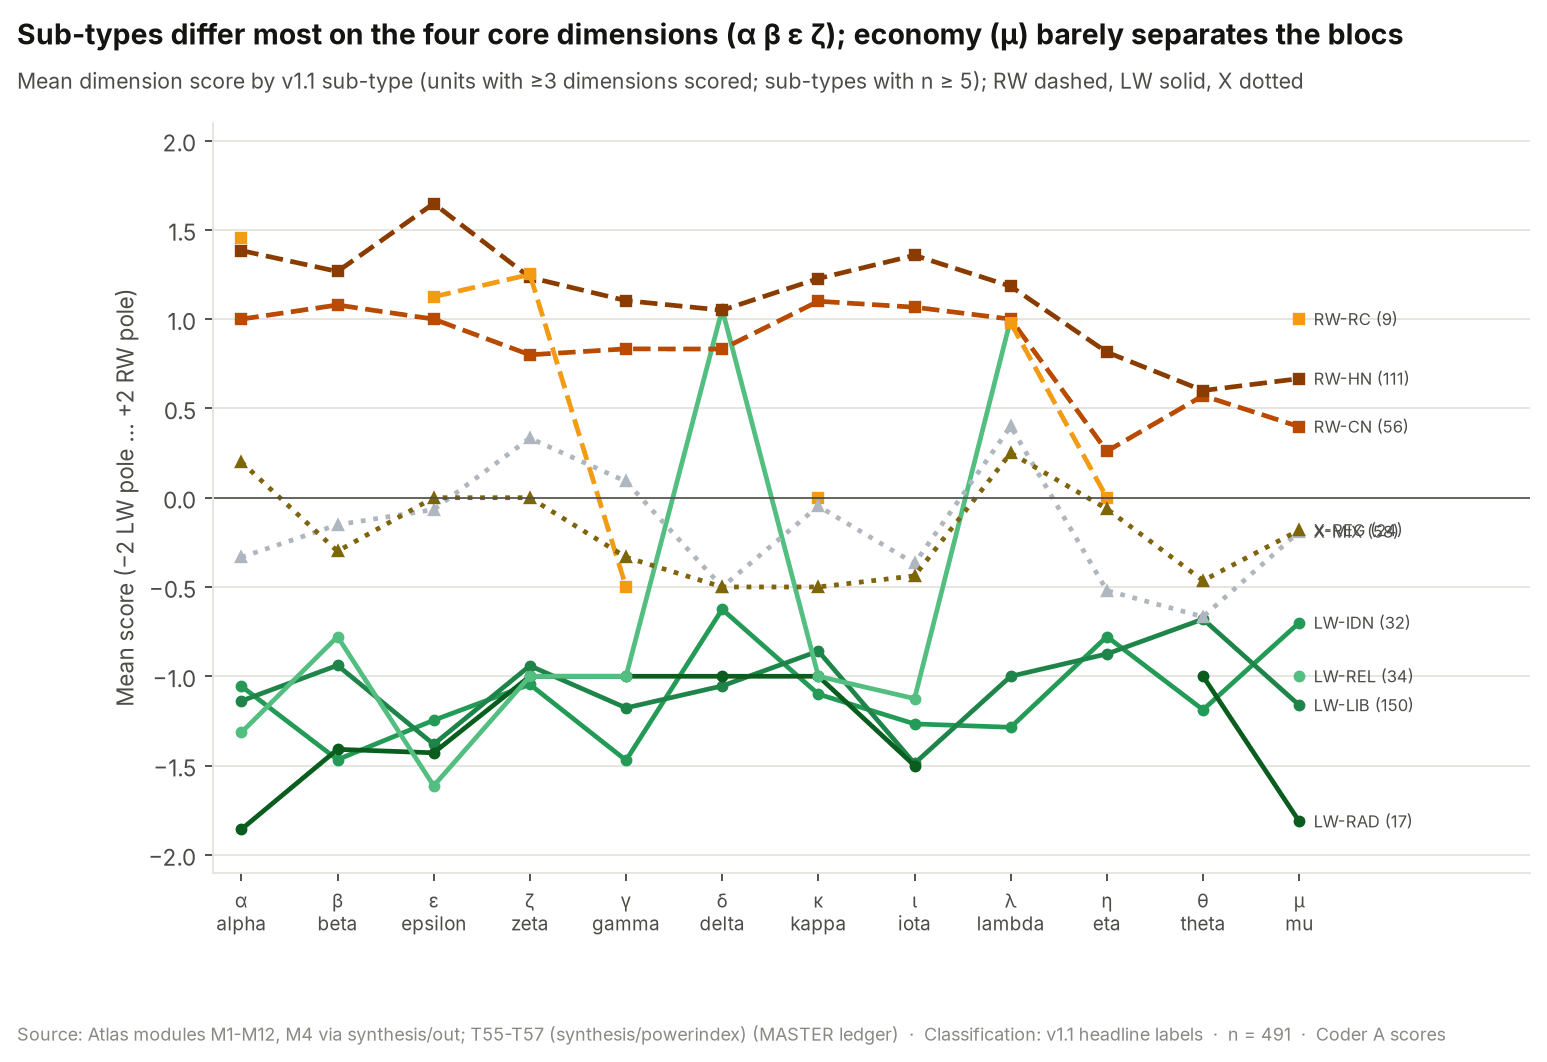
Source: Atlas synthesis.
59.9Lens agreement per unit
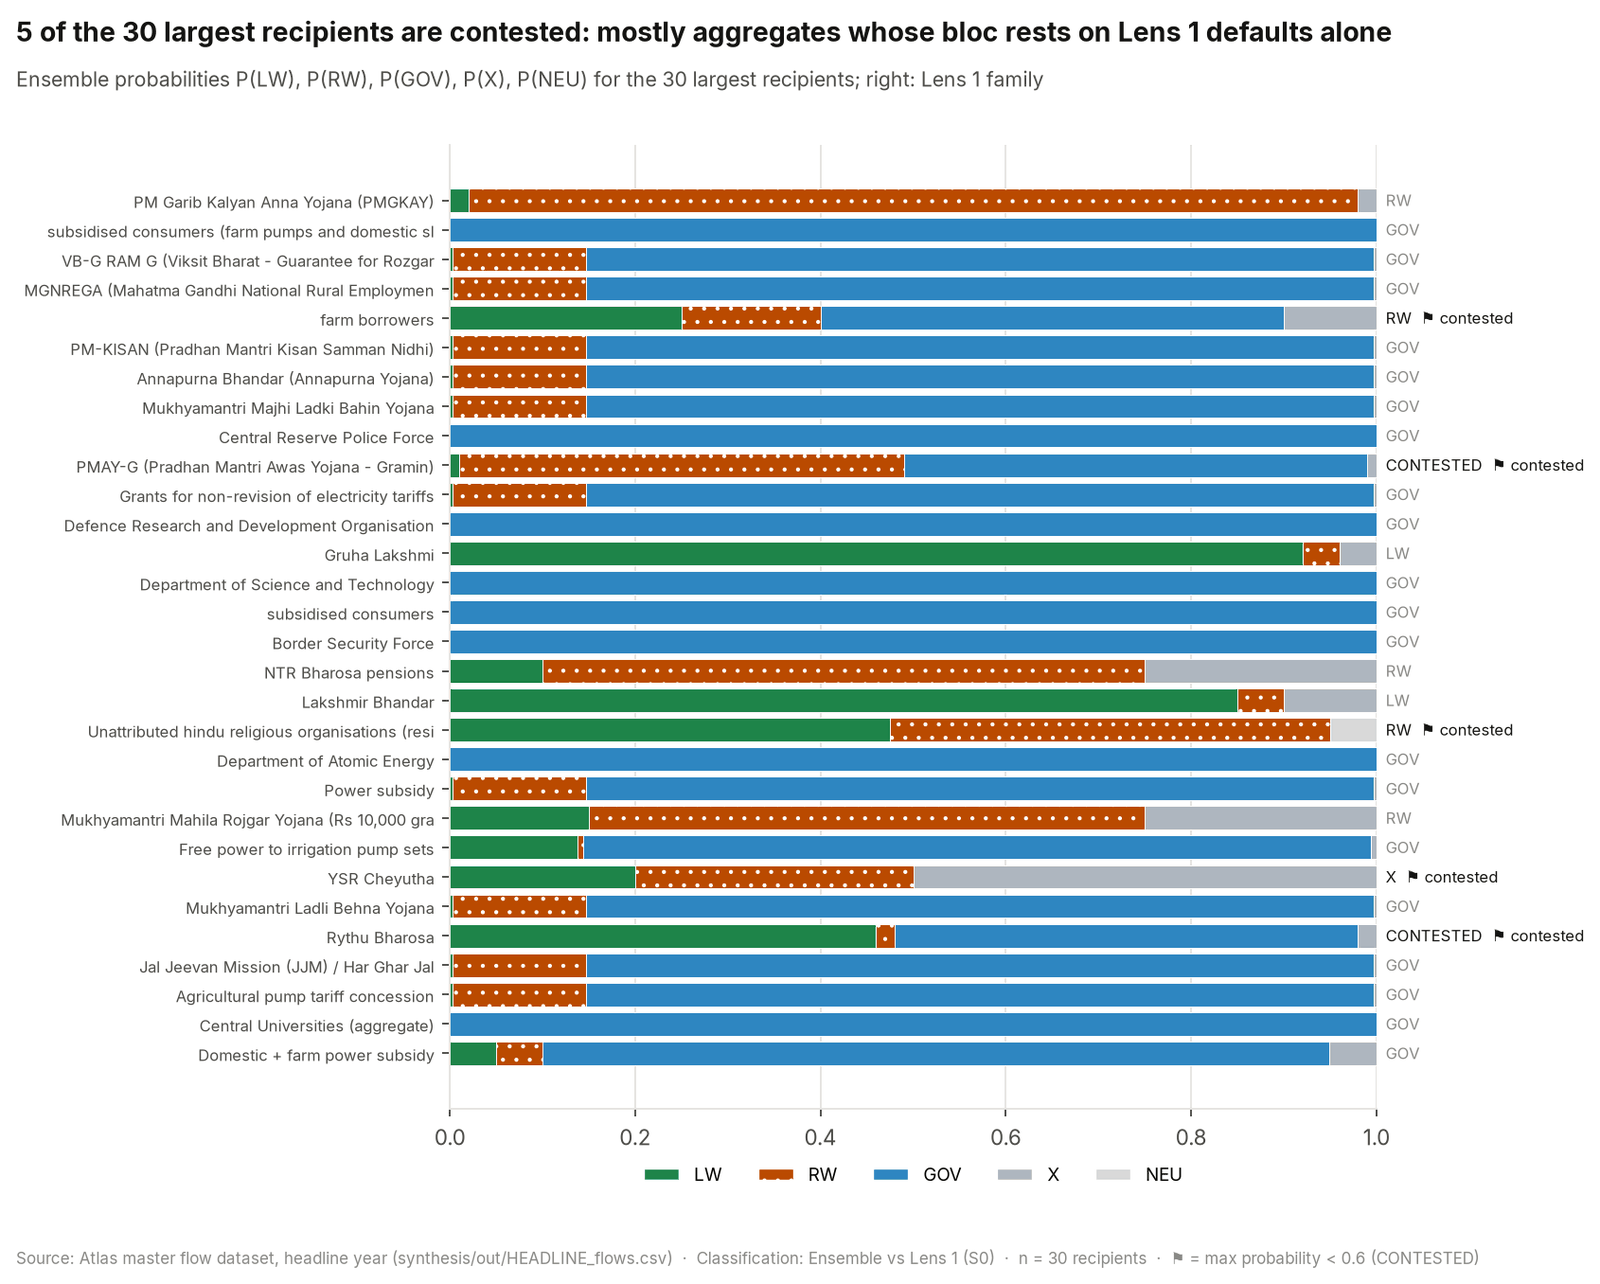
Source: Atlas master flow dataset, headline year (synthesis/out/HEADLINE_flows.csv).
Ensemble probabilities P(LW), P(RW), P(GOV), P(X), P(NEU) for the 30 largest recipients; right: Lens 1 family. n = 30 recipients. Classification basis: Ensemble vs Lens 1 (S0).
59.10Classification sensitivity tornado S0–S7
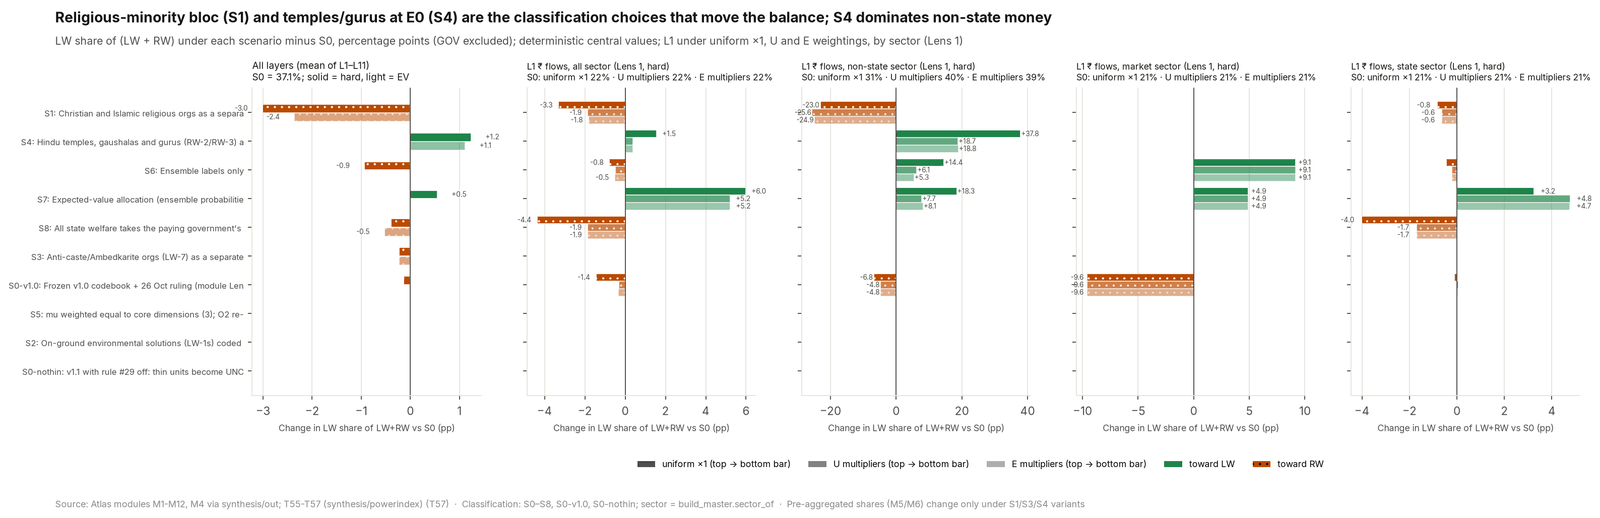
Source: Atlas synthesis.
59.11Label probability distributions by domain
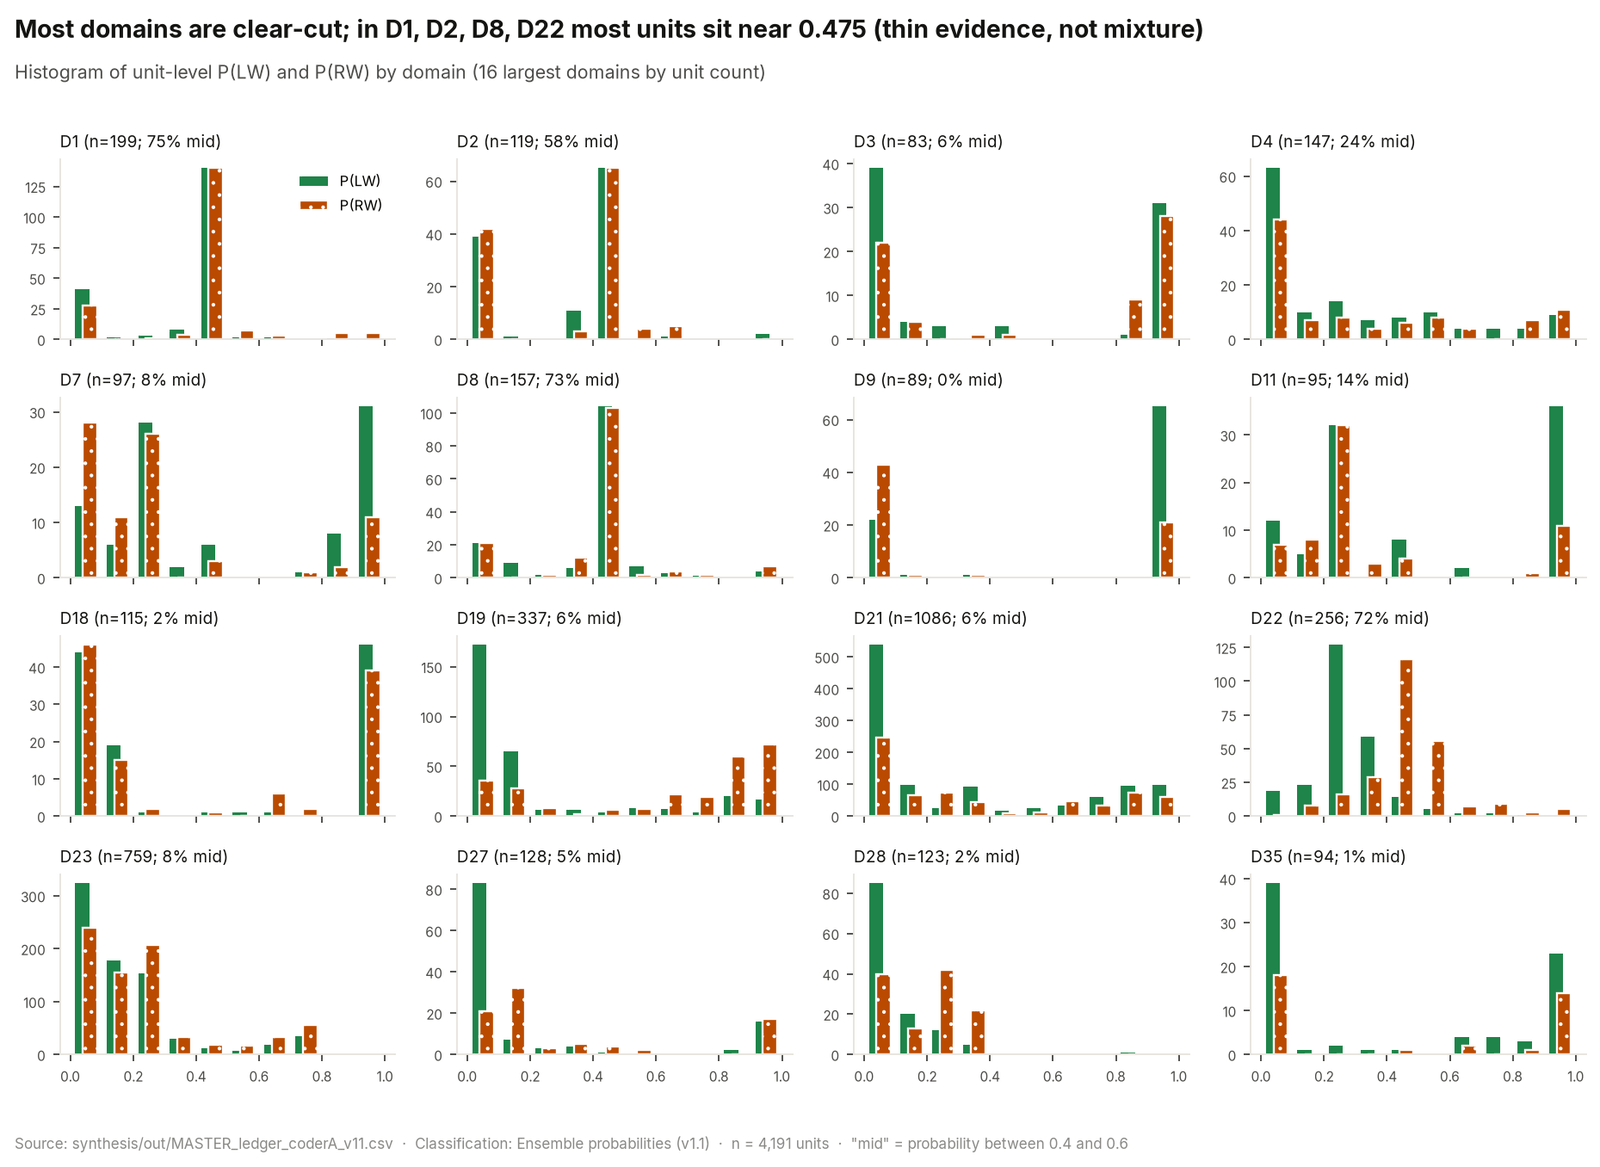
Source: synthesis/out/MASTER_ledger_coderA_v11.csv.
Histogram of unit-level P(LW) and P(RW) by domain (16 largest domains by unit count). n = 4,191 units. Classification basis: Ensemble probabilities (v1.1).
59.12Bloc-transition timeline
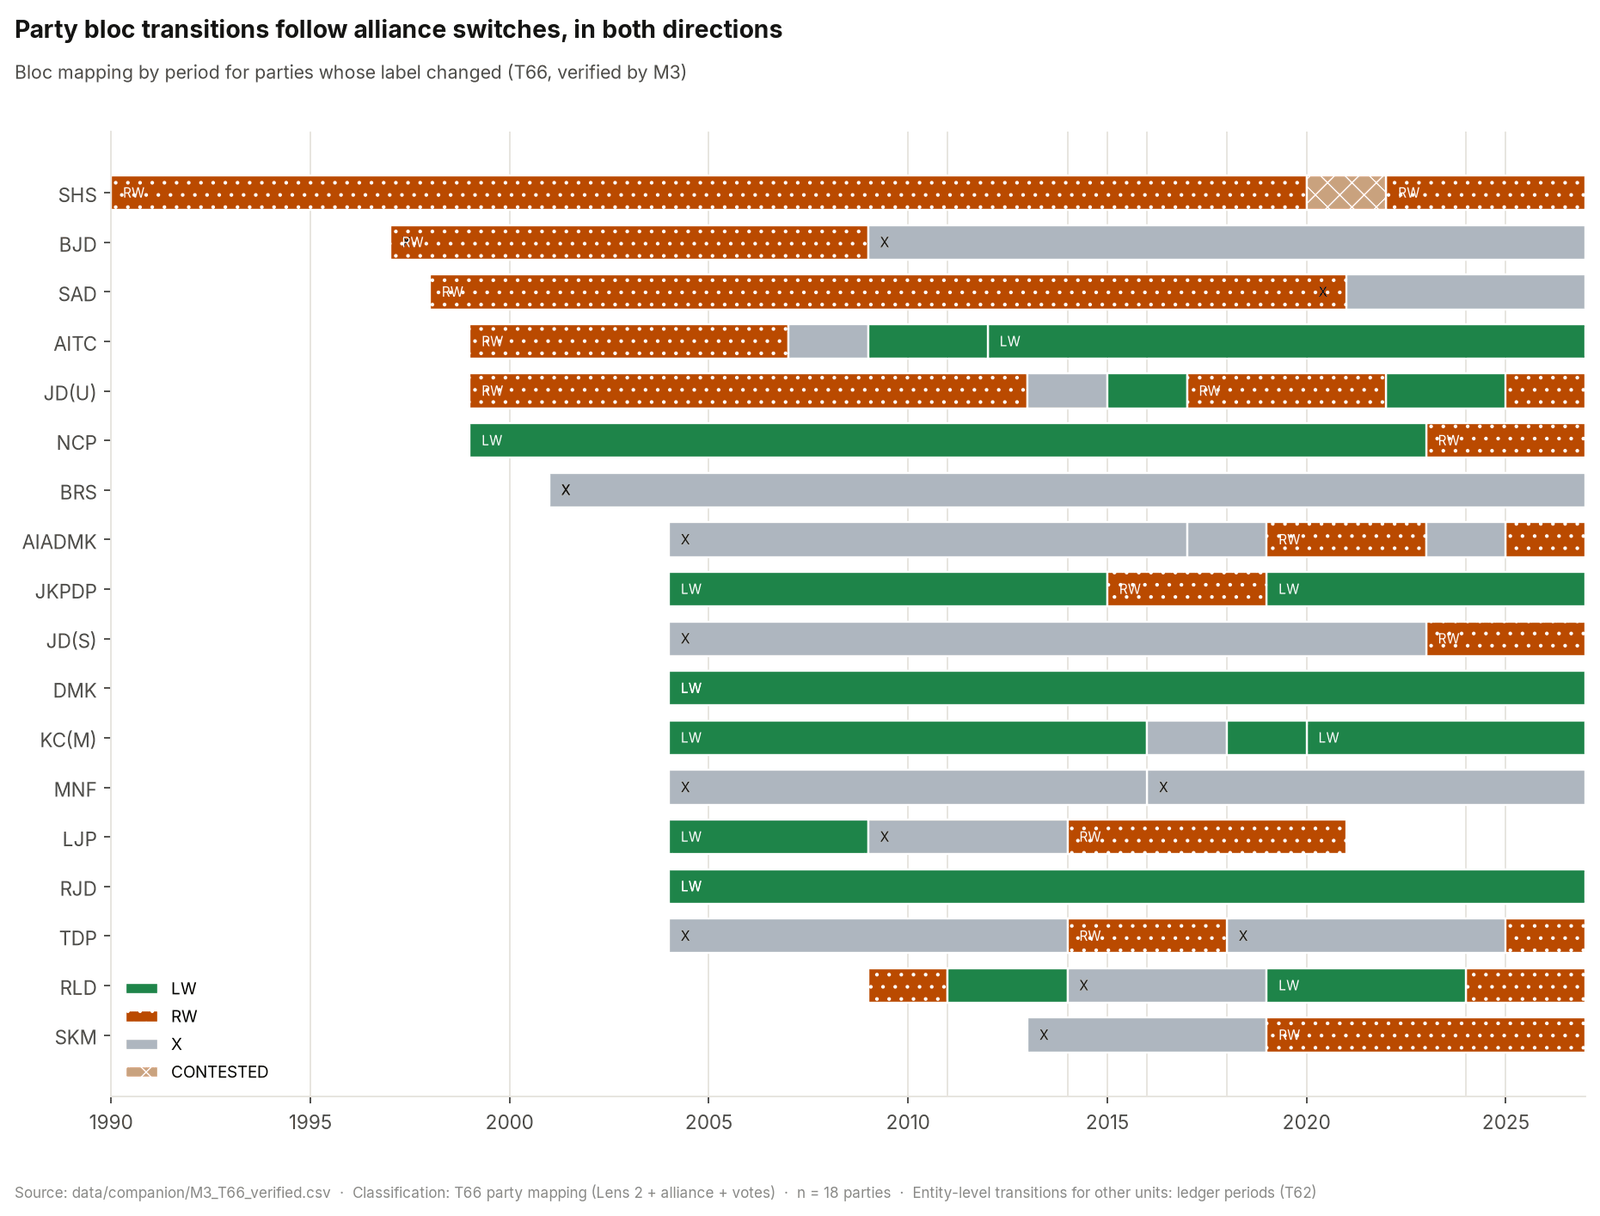
Source: data/companion/M3_T66_verified.csv.
Bloc mapping by period for parties whose label changed (T66, verified by M3). n = 18 parties. Classification basis: T66 party mapping (Lens 2 + alliance + votes).
59.13Funder portfolio dumbbell
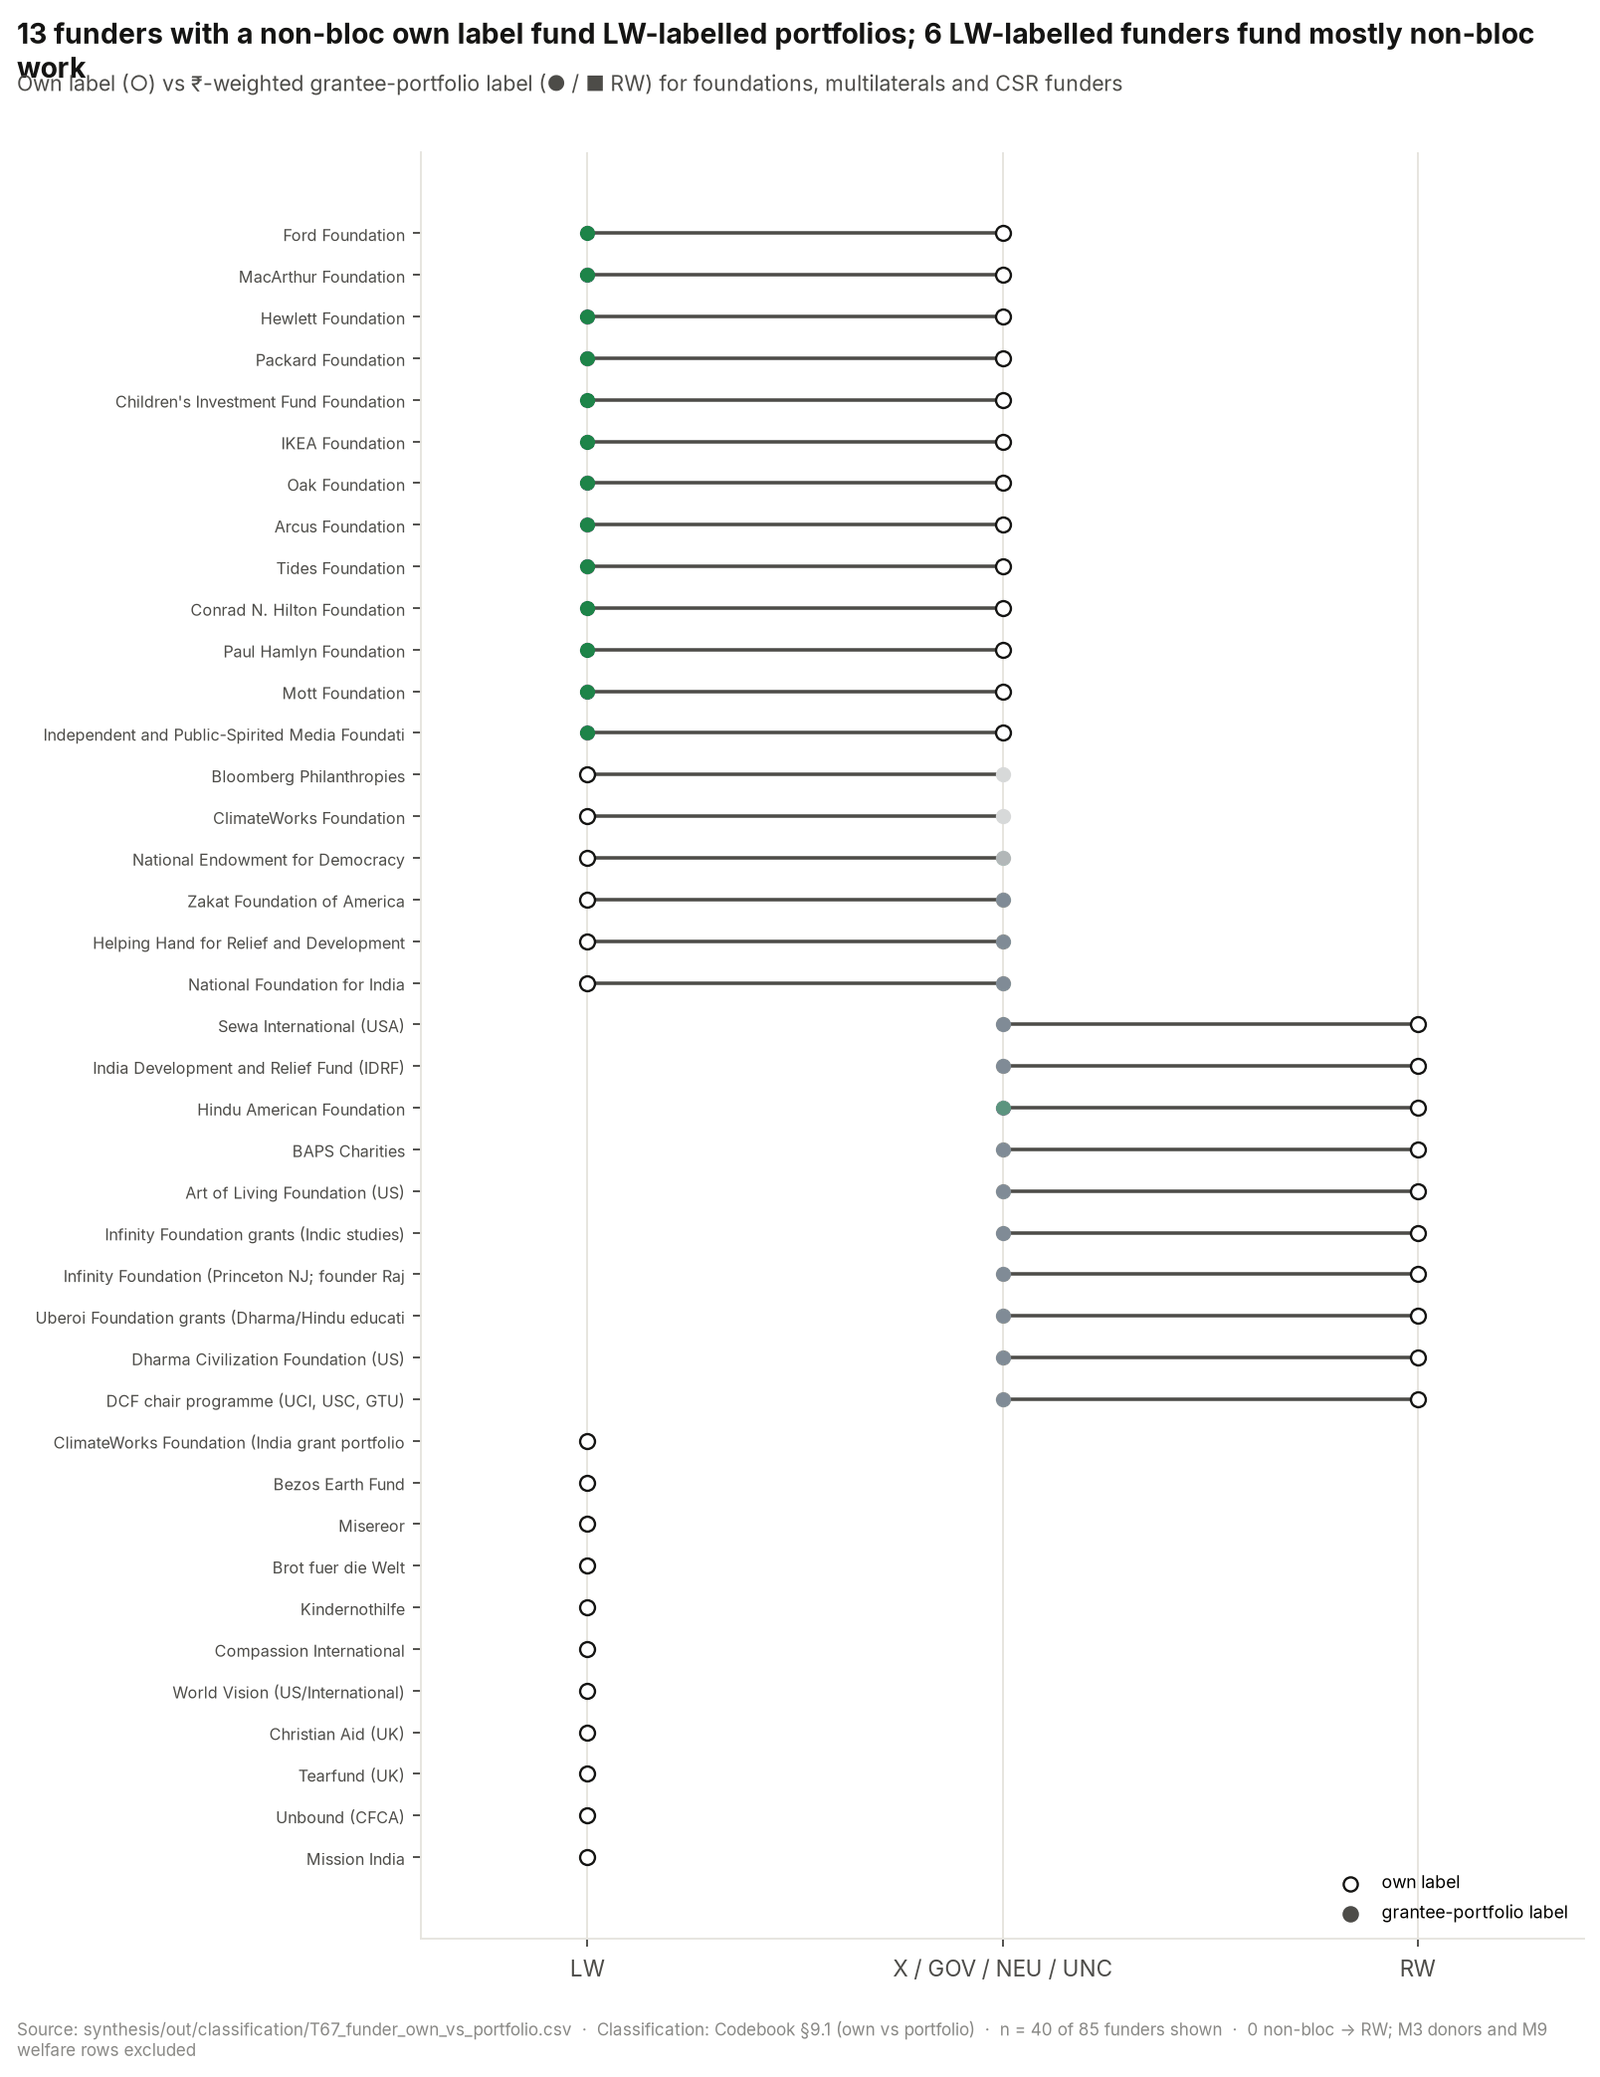
Source: synthesis/out/classification/T67_funder_own_vs_portfolio.csv.
Own label (○) vs ₹-weighted grantee-portfolio label (● / ■ RW) for foundations, multilaterals and CSR funders. n = 40 of 85 funders shown. Classification basis: Codebook §9.1 (own vs portfolio).